RBS 2007 Annual Report Download - page 64
Download and view the complete annual report
Please find page 64 of the 2007 RBS annual report below. You can navigate through the pages in the report by either clicking on the pages listed below, or by using the keyword search tool below to find specific information within the annual report.-
 1
1 -
2
-
3
-
4
-
5
-
6
-
7
-
8
-
9
-
10
-
11
-
12
-
13
-
14
-
15
-
16
-
17
-
18
-
19
-
20
-
21
-
22
-
23
-
24
-
25
-
26
-
27
-
28
-
29
-
30
-
31
-
32
-
33
-
34
-
35
-
36
-
37
-
38
-
39
-
40
-
41
-
42
-
43
-
44
-
45
-
46
-
47
-
48
-
49
-
50
-
51
-
52
-
53
-
 54
54 -
 55
55 -
 56
56 -
 57
57 -
 58
58 -
 59
59 -
 60
60 -
 61
61 -
 62
62 -
 63
63 -
 64
64 -
 65
65 -
 66
66 -
 67
67 -
 68
68 -
 69
69 -
 70
70 -
 71
71 -
 72
72 -
 73
73 -
 74
74 -
75
-
76
-
77
-
78
-
79
-
80
-
81
-
82
-
83
-
84
-
85
-
86
-
87
-
88
-
89
-
90
-
91
-
92
-
93
-
94
-
95
-
96
-
97
-
98
-
99
-
100
-
101
-
102
-
103
-
104
-
105
-
106
-
107
-
108
-
109
-
110
-
111
-
112
-
113
-
114
-
115
-
116
-
117
-
118
-
119
-
120
-
121
-
122
-
123
-
124
-
125
-
126
-
127
-
128
-
129
-
130
-
131
-
132
-
133
-
134
-
135
-
136
-
137
-
138
-
139
-
140
-
141
-
142
-
143
-
144
-
145
-
146
-
147
-
148
-
149
-
150
-
151
-
152
-
153
-
154
-
155
-
156
-
157
-
158
-
159
-
160
-
161
-
162
-
163
-
164
-
165
-
166
-
167
-
168
-
169
-
170
-
171
-
172
-
173
-
174
-
175
-
176
-
177
-
178
-
179
-
180
-
181
-
182
-
183
-
184
-
185
-
186
-
187
-
188
-
189
-
190
-
191
-
192
-
193
-
194
-
195
-
196
-
197
-
198
-
199
-
200
-
201
-
202
-
203
-
204
-
205
-
206
-
207
-
208
-
209
-
210
-
211
-
212
-
213
-
214
-
215
-
216
-
217
-
218
-
219
-
220
-
221
-
222
-
223
-
224
-
225
-
226
-
227
-
228
-
229
-
230
-
231
-
232
-
233
-
234
-
235
-
236
-
237
-
238
-
239
-
240
-
241
-
242
-
243
-
244
-
245
-
246
-
247
-
248
-
249
-
250
-
251
-
252
 |
 |

RBS Group • Annual Report and Accounts 2007
62
Business review continued
Business review
2006 compared with 2005
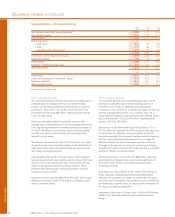
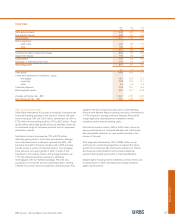
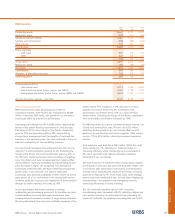
RBS Insurance increased total income by 3% to £5,679 million,
with contribution also rising by 3% to £964 million and
operating profit by the same percentage to £749 million.
We achieved overall policy growth of 1% in our businesses
including excellent progress in our European businesses.
Our joint venture in Spain grew policy numbers by 14% to
1.34 million.
In the UK we have grown our own-brand motor book by 3%
whilst focusing on more profitable customers acquired through
our direct brands, with good results achieved through the
internet channel, which accounted for half of all new own-
brand motor policies last year.
We implemented price rises in motor insurance in the second
half of the year, and average motor premium rates across the
market increased in the fourth quarter. Higher premium rates
will, however, take time to feed through into income, and
competition on prices remains strong.
Our own-brand non-motor personal lines policies were flat,
despite particularly good progress in Tesco Personal Finance.
SME has also performed well with policies sold through our
intermediary business growing by 10%.
However, some of our partnership books continue to age and
we did not renew a number of other partnerships. As a result,
the number of partnership policies in force fell by 1%.
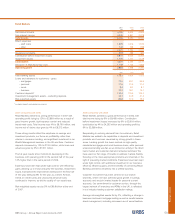
Insurance premium income was up 2% to £5,501 million,
reflecting a modest overall increase in the total number of
in-force policies.
Net fees and commissions payable increased by 8% to
£486 million, whilst other income rose by 22% to £664 million,
reflecting increased investment income.
Total expenses rose by 3% to £960 million. Good cost
discipline held direct expenses to £745 million, up 2%. Staff
costs rose by 1%, reflecting improved efficiency despite
continued investment in service standards. A 4% rise in non-
staff costs included increased marketing expenditure to
support growth in continental Europe.
Net claims rose by 4% to £3,970 million. The environment for
home claims remained benign, whilst underlying increases in
average motor claims costs were partially offset by purchasing
efficiencies and improvements in risk management.
The UK combined operating ratio for 2006, including
Manufacturing costs, was 94.6%, compared with 93.4% in
2005, reflecting a higher loss ratio and the discontinuation
of some partnerships.