RBS 2007 Annual Report Download - page 45
Download and view the complete annual report
Please find page 45 of the 2007 RBS annual report below. You can navigate through the pages in the report by either clicking on the pages listed below, or by using the keyword search tool below to find specific information within the annual report.-
 1
1 -
2
-
3
-
4
-
5
-
6
-
7
-
8
-
9
-
10
-
11
-
12
-
13
-
14
-
15
-
16
-
17
-
18
-
19
-
20
-
21
-
22
-
23
-
24
-
25
-
26
-
27
-
28
-
29
-
30
-
31
-
32
-
33
-
34
-
 35
35 -
 36
36 -
 37
37 -
 38
38 -
 39
39 -
 40
40 -
 41
41 -
 42
42 -
 43
43 -
 44
44 -
 45
45 -
 46
46 -
 47
47 -
 48
48 -
 49
49 -
 50
50 -
 51
51 -
 52
52 -
 53
53 -
 54
54 -
 55
55 -
56
-
57
-
58
-
59
-
60
-
61
-
62
-
63
-
64
-
65
-
66
-
67
-
68
-
69
-
70
-
71
-
72
-
73
-
74
-
75
-
76
-
77
-
78
-
79
-
80
-
81
-
82
-
83
-
84
-
85
-
86
-
87
-
88
-
89
-
90
-
91
-
92
-
93
-
94
-
95
-
96
-
97
-
98
-
99
-
100
-
101
-
102
-
103
-
104
-
105
-
106
-
107
-
108
-
109
-
110
-
111
-
112
-
113
-
114
-
115
-
116
-
117
-
118
-
119
-
120
-
121
-
122
-
123
-
124
-
125
-
126
-
127
-
128
-
129
-
130
-
131
-
132
-
133
-
134
-
135
-
136
-
137
-
138
-
139
-
140
-
141
-
142
-
143
-
144
-
145
-
146
-
147
-
148
-
149
-
150
-
151
-
152
-
153
-
154
-
155
-
156
-
157
-
158
-
159
-
160
-
161
-
162
-
163
-
164
-
165
-
166
-
167
-
168
-
169
-
170
-
171
-
172
-
173
-
174
-
175
-
176
-
177
-
178
-
179
-
180
-
181
-
182
-
183
-
184
-
185
-
186
-
187
-
188
-
189
-
190
-
191
-
192
-
193
-
194
-
195
-
196
-
197
-
198
-
199
-
200
-
201
-
202
-
203
-
204
-
205
-
206
-
207
-
208
-
209
-
210
-
211
-
212
-
213
-
214
-
215
-
216
-
217
-
218
-
219
-
220
-
221
-
222
-
223
-
224
-
225
-
226
-
227
-
228
-
229
-
230
-
231
-
232
-
233
-
234
-
235
-
236
-
237
-
238
-
239
-
240
-
241
-
242
-
243
-
244
-
245
-
246
-
247
-
248
-
249
-
250
-
251
-
252
 |
 |

43
RBS Group • Annual Report and Accounts 2007
Business review
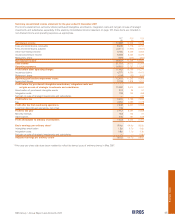
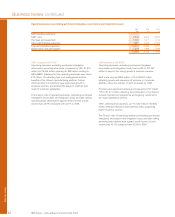
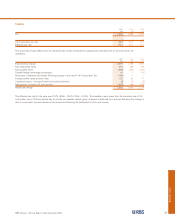
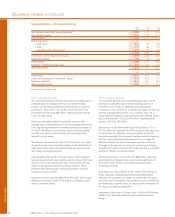
Credit market exposures
Net exposure at Average
31 December 2007 price
Group (including ABN AMRO) £m %
Super senior tranches of ABS CDOs
High grade CDOs 2,581 84
Mezzanine CDOs 1,253 70
CDO squared ——
Sub-prime trading inventory
Investment grade 937 79
Non-investment grade 255 54
Residuals 100 50
Leveraged finance 8,698 95
The Group has a leading position in structuring, distributing
and trading asset-backed securities (ABS). These activities
include buying mortgage-backed securities, including
securities backed by US sub-prime mortgages, and
repackaging them into collateralised debt obligations (CDOs)
for subsequent sale to investors. The Group retains exposure to
some of the super senior tranches of these CDOs which are all
carried at fair value.
At 31 December 2007 the Group’s exposure to these super
senior tranches, net of hedges and write-downs, totalled £2.6
billion to high grade CDOs, which include commercial loan
collateral as well as prime and sub-prime mortgage collateral,
and £1.3 billion to mezzanine CDOs, which are based primarily
on residential mortgage collateral. Both categories of CDO
have high attachment points. There was also £1.2 billion of
exposure to sub-prime mortgages through a trading inventory
of mortgage-backed securities and CDOs and £100 million
through securitisation residuals.
In the second half of 2007, rising mortgage delinquencies and
expectations of declining house prices in the US led to a
deterioration of the estimated value of these exposures. Our
valuations of the ABS CDO super senior exposures take into
consideration outputs from our proprietary model, observable
market benchmarks and prudent valuation adjustments.
Trading book exposures and residuals are marked to market
on the basis of direct prices, where available, or observable
market benchmarks.
Drawn leveraged finance positions totalled £8.7 billion at 31
December 2007. Positions are valued by considering recent
syndication prices in the same or similar assets, prices in the
secondary loan market, and with reference to relevant indices
for credit products such as the LevX, LCDX and ITraxx and
CDX credit default swap indices.
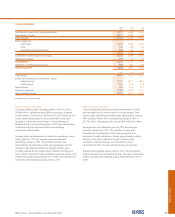
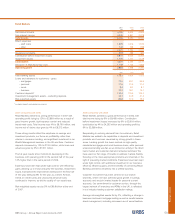
The Group has £2.2 billion of US Alt-A residential mortgage
trading inventory, of which more than 85% is investment grade.
Collateralised loan obligation exposures totalled £1.4 billion.
Commercial mortgage exposure, consisting of loans originated
for the purposes of securitisation, totalled £8.8 billion at 31
December 2007. The portfolio consisted predominantly of
commercial mortgages originated in Europe. The Group
hedges some of its positions with counterparties including
financial guarantors. At 31 December 2007 the Group had
£2.5 billion of derivative exposure to financial guarantors.
All of the above exposures are carried at fair value.
Exposure net
of hedges at
31 December 2007
Group (including ABN AMRO) £m
Alt-A
Investment grade 1,972
Non-investment grade 261
CLOs 1,386
Commercial mortgages 8,808
Financial guarantors 2,547