RBS 2007 Annual Report Download - page 161
Download and view the complete annual report
Please find page 161 of the 2007 RBS annual report below. You can navigate through the pages in the report by either clicking on the pages listed below, or by using the keyword search tool below to find specific information within the annual report.-
 1
1 -
2
-
3
-
4
-
5
-
6
-
7
-
8
-
9
-
10
-
11
-
12
-
13
-
14
-
15
-
16
-
17
-
18
-
19
-
20
-
21
-
22
-
23
-
24
-
25
-
26
-
27
-
28
-
29
-
30
-
31
-
32
-
33
-
34
-
35
-
36
-
37
-
38
-
39
-
40
-
41
-
42
-
43
-
44
-
45
-
46
-
47
-
48
-
49
-
50
-
51
-
52
-
53
-
54
-
55
-
56
-
57
-
58
-
59
-
60
-
61
-
62
-
63
-
64
-
65
-
66
-
67
-
68
-
69
-
70
-
71
-
72
-
73
-
74
-
75
-
76
-
77
-
78
-
79
-
80
-
81
-
82
-
83
-
84
-
85
-
86
-
87
-
88
-
89
-
90
-
91
-
92
-
93
-
94
-
95
-
96
-
97
-
98
-
99
-
100
-
101
-
102
-
103
-
104
-
105
-
106
-
107
-
108
-
109
-
110
-
111
-
112
-
113
-
114
-
115
-
116
-
117
-
118
-
119
-
120
-
121
-
122
-
123
-
124
-
125
-
126
-
127
-
128
-
129
-
130
-
131
-
132
-
133
-
134
-
135
-
136
-
137
-
138
-
139
-
140
-
141
-
142
-
143
-
144
-
145
-
146
-
147
-
148
-
149
-
150
-
 151
151 -
 152
152 -
 153
153 -
 154
154 -
 155
155 -
 156
156 -
 157
157 -
 158
158 -
 159
159 -
 160
160 -
 161
161 -
 162
162 -
 163
163 -
 164
164 -
 165
165 -
 166
166 -
 167
167 -
 168
168 -
 169
169 -
 170
170 -
 171
171 -
172
-
173
-
174
-
175
-
176
-
177
-
178
-
179
-
180
-
181
-
182
-
183
-
184
-
185
-
186
-
187
-
188
-
189
-
190
-
191
-
192
-
193
-
194
-
195
-
196
-
197
-
198
-
199
-
200
-
201
-
202
-
203
-
204
-
205
-
206
-
207
-
208
-
209
-
210
-
211
-
212
-
213
-
214
-
215
-
216
-
217
-
218
-
219
-
220
-
221
-
222
-
223
-
224
-
225
-
226
-
227
-
228
-
229
-
230
-
231
-
232
-
233
-
234
-
235
-
236
-
237
-
238
-
239
-
240
-
241
-
242
-
243
-
244
-
245
-
246
-
247
-
248
-
249
-
250
-
251
-
252
 |
 |

159
RBS Group • Annual Report and Accounts 2007
Financial statements
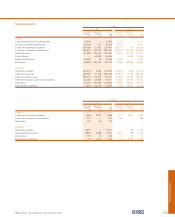
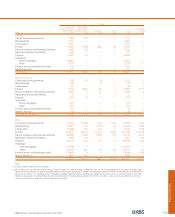
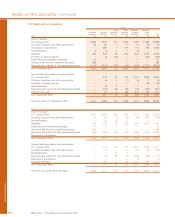
The tables below show the fair value of available-for-sale debt securities that were in an unrealised loss position.
Less than 12 months More than 12 months Total
Gross Gross Gross
unrealised unrealised unrealised
Fair value losses Fair value losses Fair value losses
2007 £m £m £m £m £m £m
UK government — — 114 — 114 —
US government, state, and federal agency 2,704 38 2,146 24 4,850 62
Other government 18,802 275 655 1 19,457 276
US government sponsored entity 1,133 11 4,190 55 5,323 66
Bank and building society 715 26 671 16 1,386 42
Mortgage-backed securities (1) 17,062 68 1,480 47 18,542 115
Corporate 1,053 11 542 11 1,595 22
Other 1,403 10 — — 1,403 10
42,872 439 9,798 154 52,670 593
2006
UK government 263 5 — — 263 5
US government, state, and federal agency 829 10 4,215 78 5,044 88
Other government 63 3 633 17 696 20
US government sponsored entity 1,102 17 5,149 125 6,251 142
Bank and building society 2,245 3 268 5 2,513 8
Mortgage-backed securities (1) 624 14 1,440 33 2,064 47
Corporate 827 14 62 2 889 16
Other 44 13 — — 44 13
5,997 79 11,767 260 17,764 339
Note:
(1) Excludes securities issued by US federal agencies and government sponsored entities.
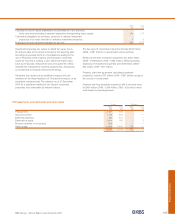
Gross gains of £60 million (2006 – £34 million) and gross losses of £12 million (2006 – £19 million) were realised on the sale of
available-for-sale securities.
Interest receivable includes £2,197 million (2006 – £1,559 million; 2005 – £1,624 million) in respect of debt securities.