RBS 2007 Annual Report Download - page 144
Download and view the complete annual report
Please find page 144 of the 2007 RBS annual report below. You can navigate through the pages in the report by either clicking on the pages listed below, or by using the keyword search tool below to find specific information within the annual report.-
 1
1 -
2
-
3
-
4
-
5
-
6
-
7
-
8
-
9
-
10
-
11
-
12
-
13
-
14
-
15
-
16
-
17
-
18
-
19
-
20
-
21
-
22
-
23
-
24
-
25
-
26
-
27
-
28
-
29
-
30
-
31
-
32
-
33
-
34
-
35
-
36
-
37
-
38
-
39
-
40
-
41
-
42
-
43
-
44
-
45
-
46
-
47
-
48
-
49
-
50
-
51
-
52
-
53
-
54
-
55
-
56
-
57
-
58
-
59
-
60
-
61
-
62
-
63
-
64
-
65
-
66
-
67
-
68
-
69
-
70
-
71
-
72
-
73
-
74
-
75
-
76
-
77
-
78
-
79
-
80
-
81
-
82
-
83
-
84
-
85
-
86
-
87
-
88
-
89
-
90
-
91
-
92
-
93
-
94
-
95
-
96
-
97
-
98
-
99
-
100
-
101
-
102
-
103
-
104
-
105
-
106
-
107
-
108
-
109
-
110
-
111
-
112
-
113
-
114
-
115
-
116
-
117
-
118
-
119
-
120
-
121
-
122
-
123
-
124
-
125
-
126
-
127
-
128
-
129
-
130
-
131
-
132
-
133
-
 134
134 -
 135
135 -
 136
136 -
 137
137 -
 138
138 -
 139
139 -
 140
140 -
 141
141 -
 142
142 -
 143
143 -
 144
144 -
 145
145 -
 146
146 -
 147
147 -
 148
148 -
 149
149 -
 150
150 -
 151
151 -
 152
152 -
 153
153 -
 154
154 -
155
-
156
-
157
-
158
-
159
-
160
-
161
-
162
-
163
-
164
-
165
-
166
-
167
-
168
-
169
-
170
-
171
-
172
-
173
-
174
-
175
-
176
-
177
-
178
-
179
-
180
-
181
-
182
-
183
-
184
-
185
-
186
-
187
-
188
-
189
-
190
-
191
-
192
-
193
-
194
-
195
-
196
-
197
-
198
-
199
-
200
-
201
-
202
-
203
-
204
-
205
-
206
-
207
-
208
-
209
-
210
-
211
-
212
-
213
-
214
-
215
-
216
-
217
-
218
-
219
-
220
-
221
-
222
-
223
-
224
-
225
-
226
-
227
-
228
-
229
-
230
-
231
-
232
-
233
-
234
-
235
-
236
-
237
-
238
-
239
-
240
-
241
-
242
-
243
-
244
-
245
-
246
-
247
-
248
-
249
-
250
-
251
-
252
 |
 |

RBS Group • Annual Report and Accounts 2007
142
Financial statements
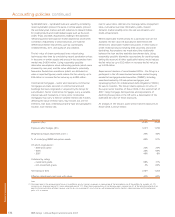
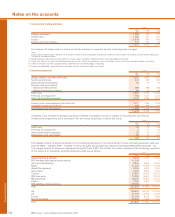
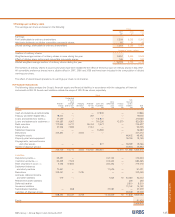
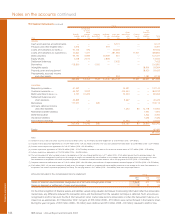
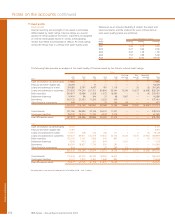
3 Pension costs (continued)
Main scheme All schemes
Present Present
value of Net value of Net
Fair value defined pension Fair value defined pension
of plan benefit deficit/ of plan benefit deficit/
assets obligations (surplus) assets obligations (surplus)
Changes in value of net pension deficit/(surplus) £m £m £m £m £m £m
At 1 January 2006 15,914 19,118 3,204 17,388 21,123 3,735
Currency translation and other adjustments — — — (59) (65) (6)
Income statement:
Expected return 1,022 (1,022) 1,073 (1,073)
Interest cost 918 918 985 985
Current service cost 571 571 645 645
Past service cost 15 15 23 23
1,022 1,504 482 1,073 1,653 580
Statement of recognised income and expense:
Actuarial gains and losses 552 (1,077) (1,629) 587 (1,194) (1,781)
Contributions by employer 427 — (427) 536 — (536)
Benefits paid (515) (515) — (538) (538) —
Expenses included in service cost (26) (26) — (28) (28) —
At 1 January 2007 17,374 19,004 1,630 18,959 20,951 1,992
Currency translation and other adjustments — — — 381 385 4
Income statement:
Expected return 1,182 (1,182) 1,394 (1,394)
Interest cost 1,007 1,007 1,177 1,177
Current service cost 566 566 684 684
Past service cost 19 19 22 22
1,182 1,592 410 1,394 1,883 489
Statement of recognised income and expense:
Actuarial gains and losses 163 (1,937) (2,100) 19 (2,170) (2,189)
Acquisition of subsidiaries — — — 6,997 6,960 (37)
Intra-group transfers 30 30————
Contributions by employer 416 — (416) 599 — (599)
Contributions by plan participants — — — 5 5 —
Benefits paid (551) (551) — (652) (652) —
Expenses included in service cost (39) (39) — (40) (40) —
At 31 December 2007 18,575 18,099 (476) 27,662 27,322 (340)
Net pension surplus comprises: £m
Net assets of schemes in surplus (included in Prepayments, accrued income and other assets, Note 19) (836)
Net liabilities of schemes in deficit 496
(340)
Acquisition of subsidiaries includes fair value of plan assets of £6,118 million and present value of defined benefit obligations £5,962 million
in respect of ABN AMRO's principal pension scheme in the Netherlands. At 31 December 2007, these were £6,417 million and £6,189
million respectively. The principal actuarial assumptions at 31 December 2007 were: discount rate 5.4%; expected return on plan assets
(weighted average) 6.2%; rate of increase in salaries 2.5%; rate of increase in pensions in payment 2.0%; and inflation assumption 2.0%.
The Group expects to contribute £481 million to its defined benefit pension schemes in 2008 (Main scheme – £413 million).
Of the net liabilities of schemes in deficit, £212 million (2006 – £106 million) relates to unfunded schemes.
Cumulative net actuarial gains of £1,570 million (2006 – £619 million losses; 2005 – £2,400 million losses) have been recognised in the
statement of recognised income and expense, of which £1,579 million (2006 – £521 million losses; 2005 – £2,150 million losses) relate
to the Main scheme.
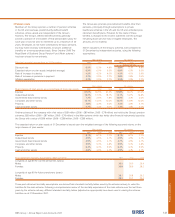
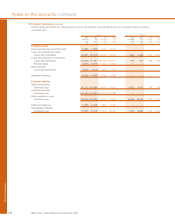
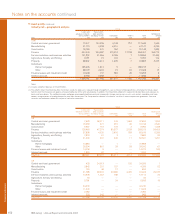
Main scheme All schemes
2007 2006 2005 2004 2007 2006 2005 2004
History of defined benefit schemes £m £m £m £m £m £m £m £m
Fair value of plan assets 18,575 17,374 15,914 13,569 27,662 18,959 17,388 14,798
Present value of defined benefit obligations 18,099 19,004 19,118 16,051 27,322 20,951 21,123 17,738
Net surplus/(deficit) 476 (1,630) (3,204) (2,482) 340 (1,992) (3,735) (2,940)
Experience losses on plan liabilities (256) (4) (41) (624) (210) (19) (68) (631)
Experience gains on plan assets 163 552 1,556 392 19 587 1,660 408
Actual return on pension schemes assets 1,345 1,574 2,486 1,230 1,413 1,660 2,677 1,328
Notes on the accounts continued