RBS 2007 Annual Report Download - page 86
Download and view the complete annual report
Please find page 86 of the 2007 RBS annual report below. You can navigate through the pages in the report by either clicking on the pages listed below, or by using the keyword search tool below to find specific information within the annual report.-
 1
1 -
2
-
3
-
4
-
5
-
6
-
7
-
8
-
9
-
10
-
11
-
12
-
13
-
14
-
15
-
16
-
17
-
18
-
19
-
20
-
21
-
22
-
23
-
24
-
25
-
26
-
27
-
28
-
29
-
30
-
31
-
32
-
33
-
34
-
35
-
36
-
37
-
38
-
39
-
40
-
41
-
42
-
43
-
44
-
45
-
46
-
47
-
48
-
49
-
50
-
51
-
52
-
53
-
54
-
55
-
56
-
57
-
58
-
59
-
60
-
61
-
62
-
63
-
64
-
65
-
66
-
67
-
68
-
69
-
70
-
71
-
72
-
73
-
74
-
75
-
 76
76 -
 77
77 -
 78
78 -
 79
79 -
 80
80 -
 81
81 -
 82
82 -
 83
83 -
 84
84 -
 85
85 -
 86
86 -
 87
87 -
 88
88 -
 89
89 -
 90
90 -
 91
91 -
 92
92 -
 93
93 -
 94
94 -
 95
95 -
 96
96 -
97
-
98
-
99
-
100
-
101
-
102
-
103
-
104
-
105
-
106
-
107
-
108
-
109
-
110
-
111
-
112
-
113
-
114
-
115
-
116
-
117
-
118
-
119
-
120
-
121
-
122
-
123
-
124
-
125
-
126
-
127
-
128
-
129
-
130
-
131
-
132
-
133
-
134
-
135
-
136
-
137
-
138
-
139
-
140
-
141
-
142
-
143
-
144
-
145
-
146
-
147
-
148
-
149
-
150
-
151
-
152
-
153
-
154
-
155
-
156
-
157
-
158
-
159
-
160
-
161
-
162
-
163
-
164
-
165
-
166
-
167
-
168
-
169
-
170
-
171
-
172
-
173
-
174
-
175
-
176
-
177
-
178
-
179
-
180
-
181
-
182
-
183
-
184
-
185
-
186
-
187
-
188
-
189
-
190
-
191
-
192
-
193
-
194
-
195
-
196
-
197
-
198
-
199
-
200
-
201
-
202
-
203
-
204
-
205
-
206
-
207
-
208
-
209
-
210
-
211
-
212
-
213
-
214
-
215
-
216
-
217
-
218
-
219
-
220
-
221
-
222
-
223
-
224
-
225
-
226
-
227
-
228
-
229
-
230
-
231
-
232
-
233
-
234
-
235
-
236
-
237
-
238
-
239
-
240
-
241
-
242
-
243
-
244
-
245
-
246
-
247
-
248
-
249
-
250
-
251
-
252
 |
 |

RBS Group • Annual Report and Accounts 2007
84
Business review continued
Business review
2007 2006
Average Period end Maximum Minimum Average Period end Maximum Minimum
Excluding ABN AMRO £m £m £m £m £m £m £m £m
Interest rate 11.7 9.6 17.6 7.6 8.7 10.2 15.0 5.7
Credit spread 17.7 37.9 44.0 12.6 13.2 14.1 15.7 10.4
Currency 2.6 2.6 6.9 1.1 2.2 2.5 3.5 1.0
Equity 2.4 1.9 6.8 1.4 1.1 1.6 4.4 0.5
Commodity 0.2 0.1 1.6 — 0.2 — 1.1 —
Diversification (12.4) (12.8)
Total trading VaR 20.3 39.7 45.5 13.2 14.2 15.6 18.9 10.4
The market risk function is independent of the Group’s trading
businesses and is responsible for:
•effective application and compliance with the Group’s
Market Risk Policy Statement (MRPS), aligning the market
risk taken by the Group with the risk limits set by GEMC;
•identification, measurement, monitoring, analysis and
reporting of the market risk generated by the various
businesses; and
•determination of appropriate policies and methodologies to
measure and control market risk.
Market risk measurement methodology
The Group uses a number of approaches to measure market
risk in its trading and treasury portfolios. These approaches
include:
(i) VaR
VaR is a technique that produces estimates of the potential
negative change in the market value of a portfolio over a
specified time horizon at given confidence levels. For internal
risk management purposes, the Group’s VaR assumes a time
horizon of one trading day and a confidence level of 95%. The
Group also calculates VaR at a confidence interval of 99% and
a time horizon of ten trading days for the purposes of
calculating trading book market risk capital.
The Group uses historical simulation models in computing VaR.
This approach, in common with many other VaR models,
assumes that risk factor changes observed in the past are a
good estimate of those likely to occur in the future and is,
therefore, limited by the relevance of the historical data used.
The Group’s method, however, does not make any assumption
about the nature or type of underlying loss distribution. The Group
typically uses the previous 500 trading days of market data.
The Group calculates both general market risk (i.e. the risk due
to movement in general market benchmarks) and idiosyncratic
market risk (i.e. the risk due to movements in the value of
securities by reference to specific issuers) using its VaR models.
The Group’s VaR should be interpreted in light of the
limitations of the methodology used. These limitations include:
•Historical data may not provide the best estimate of the joint
distribution of risk factor changes in the future and may fail
to capture the risk of possible extreme adverse market
movements which have not occurred in the historical window
used in the calculations.
•VaR using a one-day time horizon does not fully capture the
market risk of positions that cannot be liquidated or hedged
within one day.
•VaR using a 95% confidence level does not reflect the extent
of potential losses beyond that percentile.
The Group largely computes the VaR of trading portfolios at
the close of business and positions may change substantially
during the course of the trading day. Further controls are in
place to limit the Group’s intra-day exposure, such as the
calculation of the VaR for selected portfolios. These limitations
and the nature of the VaR measure mean that the Group
cannot guarantee that losses will not exceed the VaR amounts
indicated. The Group undertakes stress testing to identify the
potential for losses in excess of the VaR.
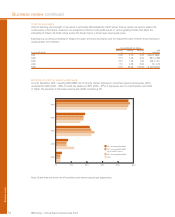
The VaR for the Group’s trading portfolios segregated by type of market risk exposure, including idiosyncratic risk, is presented in
the table below.
2007
Average Period end Maximum Minimum
Including ABN AMRO £m £m £m £m
Interest rate 12.5 15.0 21.8 7.6
Credit spread 18.8 41.9 45.2 12.6
Currency 2.6 3.0 6.9 1.1
Equity 5.4 14.0 22.0 1.4
Commodity 0.2 0.5 1.6 —
Diversification (28.7)
Total trading VaR 21.6 45.7 50.1 13.2