RBS 2007 Annual Report Download - page 156
Download and view the complete annual report
Please find page 156 of the 2007 RBS annual report below. You can navigate through the pages in the report by either clicking on the pages listed below, or by using the keyword search tool below to find specific information within the annual report.-
 1
1 -
2
-
3
-
4
-
5
-
6
-
7
-
8
-
9
-
10
-
11
-
12
-
13
-
14
-
15
-
16
-
17
-
18
-
19
-
20
-
21
-
22
-
23
-
24
-
25
-
26
-
27
-
28
-
29
-
30
-
31
-
32
-
33
-
34
-
35
-
36
-
37
-
38
-
39
-
40
-
41
-
42
-
43
-
44
-
45
-
46
-
47
-
48
-
49
-
50
-
51
-
52
-
53
-
54
-
55
-
56
-
57
-
58
-
59
-
60
-
61
-
62
-
63
-
64
-
65
-
66
-
67
-
68
-
69
-
70
-
71
-
72
-
73
-
74
-
75
-
76
-
77
-
78
-
79
-
80
-
81
-
82
-
83
-
84
-
85
-
86
-
87
-
88
-
89
-
90
-
91
-
92
-
93
-
94
-
95
-
96
-
97
-
98
-
99
-
100
-
101
-
102
-
103
-
104
-
105
-
106
-
107
-
108
-
109
-
110
-
111
-
112
-
113
-
114
-
115
-
116
-
117
-
118
-
119
-
120
-
121
-
122
-
123
-
124
-
125
-
126
-
127
-
128
-
129
-
130
-
131
-
132
-
133
-
134
-
135
-
136
-
137
-
138
-
139
-
140
-
141
-
142
-
143
-
144
-
145
-
 146
146 -
 147
147 -
 148
148 -
 149
149 -
 150
150 -
 151
151 -
 152
152 -
 153
153 -
 154
154 -
 155
155 -
 156
156 -
 157
157 -
 158
158 -
 159
159 -
 160
160 -
 161
161 -
 162
162 -
 163
163 -
 164
164 -
 165
165 -
 166
166 -
167
-
168
-
169
-
170
-
171
-
172
-
173
-
174
-
175
-
176
-
177
-
178
-
179
-
180
-
181
-
182
-
183
-
184
-
185
-
186
-
187
-
188
-
189
-
190
-
191
-
192
-
193
-
194
-
195
-
196
-
197
-
198
-
199
-
200
-
201
-
202
-
203
-
204
-
205
-
206
-
207
-
208
-
209
-
210
-
211
-
212
-
213
-
214
-
215
-
216
-
217
-
218
-
219
-
220
-
221
-
222
-
223
-
224
-
225
-
226
-
227
-
228
-
229
-
230
-
231
-
232
-
233
-
234
-
235
-
236
-
237
-
238
-
239
-
240
-
241
-
242
-
243
-
244
-
245
-
246
-
247
-
248
-
249
-
250
-
251
-
252
 |
 |

RBS Group • Annual Report and Accounts 2007
154
Notes on the accounts continued
Financial statements
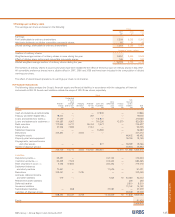
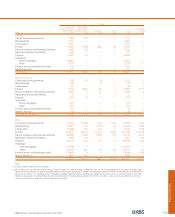
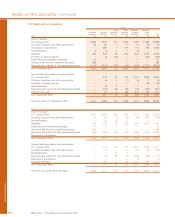
12 Past due and impaired financial assets
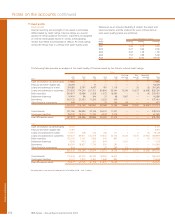
The following table shows the movement in the provision for impairment losses for loans and advances.
Group
Individually Collectively Total
assessed assessed Latent 2007 2006 2005
£m £m £m £m £m £m
At 1 January 697 2,645 593 3,935 3,887 4,174
Implementation of IAS 39 on 1 January 2005 ————— (29)
Currency translation and other adjustments 58 61 18 137 (61) 51
Acquisition of subsidiaries 952 907 351 2,210 ——
Amounts written-off (1) (525) (1,646) — (2,171) (1,841) (2,040)
Recoveries of amounts previously written-off 129 261 — 390 215 172
Charged to the income statement 274 1,744 88 2,106 1,877 1,703
Unwind of discount (28) (138) — (166) (142) (144)
At 31 December (2) 1,557 3,834 1,050 6,441 3,935 3,887
Notes:
(1) Amounts written-off include £2 million in 2005 relating to loans and advances to banks.
(2) Impairment losses at 31 December 2007 include £3 million relating to loans and advances to banks (2006 – £2 million; 2005 – £3 million).
(3) There is no provision for impairment losses in the company.
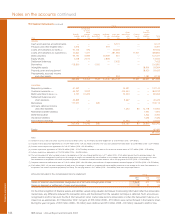
Group
2007 2006 2005
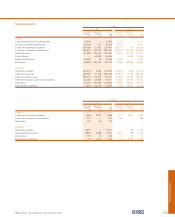
Impairment losses charged to the income statement £m £m £m
Loans and advances to customers 2,106 1,877 1,703
Debt securities 20 ——
Equity shares 2 14
22 14
2,128 1,878 1,707
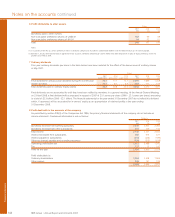
2007 2006 2005
Group £m £m £m
Gross income not recognised but which would have been recognised under the
original terms of non-accrual and restructured loans
Domestic 390 370 334
Foreign 155 77 62
545 447 396
Interest on non-accrual and restructured loans included in net interest income
Domestic 165 142 130
Foreign 16 15 14
181 157 144
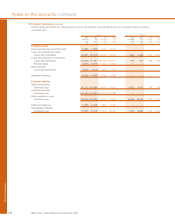
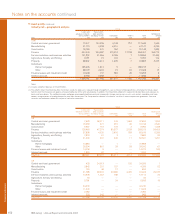
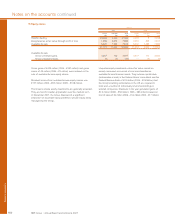
The following table shows analysis of impaired financial assets.
2007 2006
Net book Net book
Cost Provision value Cost Provision value
Group £m £m £m £m £m £m
Impaired financial assets
Loans and advances to banks (1) 25 3 22 22—
Loans and advances to customers (2) 10,337 5,388 4,949 6,230 3,340 2,890
Debt securities (1) 54133—
Equity shares (1) 142 70 72 182 85 97
10,509 5,465 5,044 6,417 3,430 2,987
Notes:
(1) Impairment provisions individually assessed.
(2) Impairment provisions individually assessed on balances of £3,178 million (2006 – £1,196 million).
The Group holds collateral in respect of certain loans and advances to banks and to customers that are past due or impaired. Such
collateral includes mortgages over property (both personal and commercial); charges over business assets such as plant, inventories
and trade debtors; and guarantees of lending from parties other than the borrower.