RBS 2007 Annual Report Download - page 160
Download and view the complete annual report
Please find page 160 of the 2007 RBS annual report below. You can navigate through the pages in the report by either clicking on the pages listed below, or by using the keyword search tool below to find specific information within the annual report.-
 1
1 -
2
-
3
-
4
-
5
-
6
-
7
-
8
-
9
-
10
-
11
-
12
-
13
-
14
-
15
-
16
-
17
-
18
-
19
-
20
-
21
-
22
-
23
-
24
-
25
-
26
-
27
-
28
-
29
-
30
-
31
-
32
-
33
-
34
-
35
-
36
-
37
-
38
-
39
-
40
-
41
-
42
-
43
-
44
-
45
-
46
-
47
-
48
-
49
-
50
-
51
-
52
-
53
-
54
-
55
-
56
-
57
-
58
-
59
-
60
-
61
-
62
-
63
-
64
-
65
-
66
-
67
-
68
-
69
-
70
-
71
-
72
-
73
-
74
-
75
-
76
-
77
-
78
-
79
-
80
-
81
-
82
-
83
-
84
-
85
-
86
-
87
-
88
-
89
-
90
-
91
-
92
-
93
-
94
-
95
-
96
-
97
-
98
-
99
-
100
-
101
-
102
-
103
-
104
-
105
-
106
-
107
-
108
-
109
-
110
-
111
-
112
-
113
-
114
-
115
-
116
-
117
-
118
-
119
-
120
-
121
-
122
-
123
-
124
-
125
-
126
-
127
-
128
-
129
-
130
-
131
-
132
-
133
-
134
-
135
-
136
-
137
-
138
-
139
-
140
-
141
-
142
-
143
-
144
-
145
-
146
-
147
-
148
-
149
-
 150
150 -
 151
151 -
 152
152 -
 153
153 -
 154
154 -
 155
155 -
 156
156 -
 157
157 -
 158
158 -
 159
159 -
 160
160 -
 161
161 -
 162
162 -
 163
163 -
 164
164 -
 165
165 -
 166
166 -
 167
167 -
 168
168 -
 169
169 -
 170
170 -
171
-
172
-
173
-
174
-
175
-
176
-
177
-
178
-
179
-
180
-
181
-
182
-
183
-
184
-
185
-
186
-
187
-
188
-
189
-
190
-
191
-
192
-
193
-
194
-
195
-
196
-
197
-
198
-
199
-
200
-
201
-
202
-
203
-
204
-
205
-
206
-
207
-
208
-
209
-
210
-
211
-
212
-
213
-
214
-
215
-
216
-
217
-
218
-
219
-
220
-
221
-
222
-
223
-
224
-
225
-
226
-
227
-
228
-
229
-
230
-
231
-
232
-
233
-
234
-
235
-
236
-
237
-
238
-
239
-
240
-
241
-
242
-
243
-
244
-
245
-
246
-
247
-
248
-
249
-
250
-
251
-
252
 |
 |

RBS Group • Annual Report and Accounts 2007
158
Notes on the accounts continued
Financial statements
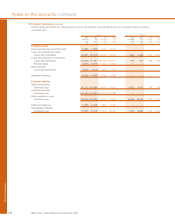
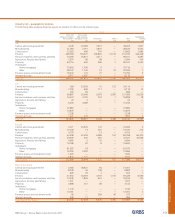
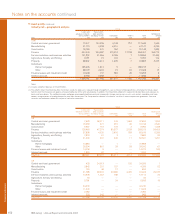
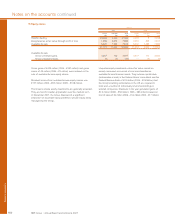
14 Debt securities
Group
US
government, US
state and government Bank and Mortgage-
UK federal Other sponsored building backed
government agency government entity society securities(1) Corporate Other Total
2007 £m £m £m £m £m £m £m £m £m
Held-for-trading 9,163 12,791 43,743 18,422 7,830 43,680 35,769 1,246 172,644
Designated as at fair value
through profit or loss 2,235 397 101 — 154 330 2,125 435 5,777
Available-for-sale 1,030 6,867 33,840 5,830 11,835 23,680 6,505 5,747 95,334
Loans and receivables — — 1,988 — — 612 — 72 2,672
12,428 20,055 79,672 24,252 19,819 68,302 44,399 7,500 276,427
Available-for-sale
Gross unrealised gains 29 14 56 3 12 15 22 1 152
Gross unrealised losses — (62) (276) (66) (42) (115) (22) (10) (593)
2006
Held-for-trading 8,122 10,965 13,839 10,065 34 28,658 23,194 315 95,192
Designated as at fair value
through profit or loss 1,730 — 85 — 609 98 2,867 600 5,989
Available-for-sale 843 6,234 1,218 6,651 4,584 3,434 2,211 334 25,509
Loans and receivables ——————21540561
10,695 17,199 15,142 16,716 5,227 32,190 28,293 1,789 127,251
Available-for-sale
Gross unrealised gains —6411612—30
Gross unrealised losses (5) (88) (20) (142) (8) (47) (16) (13) (339)
Note:
(1) Excludes securities issued by US federal agencies and government sponsored entities.
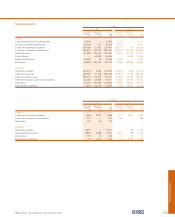
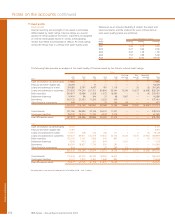
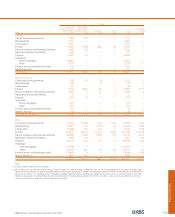
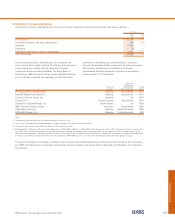
The following tables analyse by issuer the Group’s available-for-sale debt securities by remaining maturity and the related yield (based
on weighted averages).
After 1 but After 5 but
Within 1 year within 5 years within 10 years After 10 years Total
Amount Yield Amount Yield Amount Yield Amount Yield Amount Yield
2007 £m % £m % £m % £m % £m %
UK government 96 4.9 306 5.5 625 4.2 3 5.2 1,030 4.7
US government, state, and federal agency 99 4.6 167 4.9 1,431 4.2 5,170 5.2 6,867 5.0
Other government 11,933 3.8 12,515 5.3 7,262 4.0 2,130 4.3 33,840 4.4
US government sponsored entity ————445.55,786 5.0 5,830 5.0
Bank and building society 9,023 5.3 1,795 4.4 445 3.3 572 3.8 11,835 5.0
Mortgage-backed securities (1) 1,069 5.1 4,202 4.5 10,308 3.5 8,101 4.6 23,680 4.1
Corporate 1,616 3.7 3,119 5.3 1,357 4.7 413 4.7 6,505 4.7
Other 1,603 3.5 1,600 4.2 1,851 4.9 693 5.5 5,747 4.4
Total fair value 25,439 4.3 23,704 5.0 23,323 3.9 22,868 4.8 95,334 4.5
2006
UK government 562 5.6 146 5.7 97 5.0 38 4.7 843 5.5
US government, state, and federal agency 11 4.8 627 4.8 22 4.7 5,574 5.1 6,234 5.1
Other government 180 2.6 822 3.7 213 1.1 3 3.9 1,218 3.1
US government sponsored entity — — 140 5.4 368 5.6 6,143 5.0 6,651 5.0
Bank and building society 2,427 5.1 1,368 4.8 28 5.4 761 6.9 4,584 5.3
Mortgage-backed securities (1) 259 5.1 232 5.6 294 5.5 2,649 4.9 3,434 5.0
Corporate 360 3.9 1,256 4.5 413 4.7 182 4.6 2,211 4.4
Other 188 4.5 135 4.0 11 5.3 — — 334 4.3
Total fair value 3,987 4.9 4,726 4.6 1,446 4.6 15,350 5.1 25,509 4.9
Note:
(1) Excludes securities issued by US federal agencies and government sponsored entities.