RBS 2007 Annual Report Download - page 44
Download and view the complete annual report
Please find page 44 of the 2007 RBS annual report below. You can navigate through the pages in the report by either clicking on the pages listed below, or by using the keyword search tool below to find specific information within the annual report.-
 1
1 -
2
-
3
-
4
-
5
-
6
-
7
-
8
-
9
-
10
-
11
-
12
-
13
-
14
-
15
-
16
-
17
-
18
-
19
-
20
-
21
-
22
-
23
-
24
-
25
-
26
-
27
-
28
-
29
-
30
-
31
-
32
-
33
-
 34
34 -
 35
35 -
 36
36 -
 37
37 -
 38
38 -
 39
39 -
 40
40 -
 41
41 -
 42
42 -
 43
43 -
 44
44 -
 45
45 -
 46
46 -
 47
47 -
 48
48 -
 49
49 -
 50
50 -
 51
51 -
 52
52 -
 53
53 -
 54
54 -
55
-
56
-
57
-
58
-
59
-
60
-
61
-
62
-
63
-
64
-
65
-
66
-
67
-
68
-
69
-
70
-
71
-
72
-
73
-
74
-
75
-
76
-
77
-
78
-
79
-
80
-
81
-
82
-
83
-
84
-
85
-
86
-
87
-
88
-
89
-
90
-
91
-
92
-
93
-
94
-
95
-
96
-
97
-
98
-
99
-
100
-
101
-
102
-
103
-
104
-
105
-
106
-
107
-
108
-
109
-
110
-
111
-
112
-
113
-
114
-
115
-
116
-
117
-
118
-
119
-
120
-
121
-
122
-
123
-
124
-
125
-
126
-
127
-
128
-
129
-
130
-
131
-
132
-
133
-
134
-
135
-
136
-
137
-
138
-
139
-
140
-
141
-
142
-
143
-
144
-
145
-
146
-
147
-
148
-
149
-
150
-
151
-
152
-
153
-
154
-
155
-
156
-
157
-
158
-
159
-
160
-
161
-
162
-
163
-
164
-
165
-
166
-
167
-
168
-
169
-
170
-
171
-
172
-
173
-
174
-
175
-
176
-
177
-
178
-
179
-
180
-
181
-
182
-
183
-
184
-
185
-
186
-
187
-
188
-
189
-
190
-
191
-
192
-
193
-
194
-
195
-
196
-
197
-
198
-
199
-
200
-
201
-
202
-
203
-
204
-
205
-
206
-
207
-
208
-
209
-
210
-
211
-
212
-
213
-
214
-
215
-
216
-
217
-
218
-
219
-
220
-
221
-
222
-
223
-
224
-
225
-
226
-
227
-
228
-
229
-
230
-
231
-
232
-
233
-
234
-
235
-
236
-
237
-
238
-
239
-
240
-
241
-
242
-
243
-
244
-
245
-
246
-
247
-
248
-
249
-
250
-
251
-
252
 |
 |

RBS Group • Annual Report and Accounts 2007
42
Business review continued
Business review
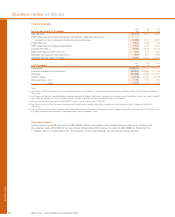
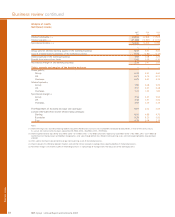
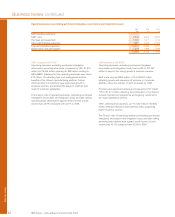
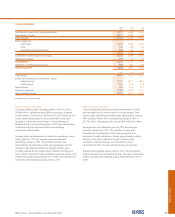
Non-interest income
2007 2006 2005
£m £m £m
Fees and commissions receivable 8,465 7,116 6,750
Fees and commissions payable (2,311) (1,922) (1,841)
Income from trading activities 1,327 2,675 2,343
Other operating income 4,857 3,564 2,620
12,338 11,433 9,872
Insurance premium income 6,398 6,243 6,076
Reinsurers’ share (289) (270) (297)
6,109 5,973 5,779
18,447 17,406 15,651
2007 compared with 2006
Non-interest income increased by 6%, £1,041 million to
£18,447 million, including £960 million from the acquisition of
ABN AMRO. Good organic growth was offset by write-downs in
Global Banking & Markets in respect of US mortgage-related
and leveraged finance exposures. Non-interest income
represents 59% of total income (2006 – 62%). Excluding
general insurance premium income, non-interest income rose
by 8%, £905 million to £12,338 million.
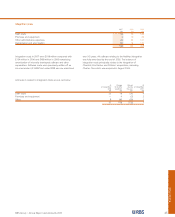
Within non-interest income, fees and commissions receivable
increased by 19% or £1,349 million, to £8,465 million, while
fees and commissions payable increased by 20%, £389 million
to £2,311 million.
Income from trading activities was down from £2,675 million to
£1,327 million. Interest rate and currency trading activities
benefitted from increased volatility and there was good growth
from a broadening product range. These improvements were,
however, more than offset by credit markets write downs (see
credit market exposures on page 43).
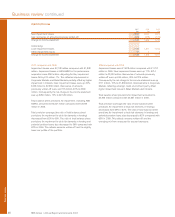
Other operating income increased by 36%, £1,293 million to
£4,857 million. This was principally due to growth in income
from rental and asset-backed activities and principal
investments in Corporate Markets.
General insurance premium income, after reinsurance,
increased by 2% to £6,109 million with good growth in policies
in the core businesses, particularly in Continental Europe.
2006 compared with 2005
Non-interest income increased by £1,755 million, 11% to
£17,406 million reflecting strong organic growth in all divisions
especially Global Banking & Markets, up 26% and Wealth
Management, up 14%. Non-interest income represents 62%
of total income (2005 – 61%). Excluding general insurance
premium income, non-interest income rose by 16% or £1,561
million to £11,433 million.
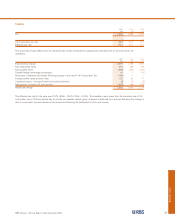
Within non-interest income, fees and commissions receivable
increased by 5% or £366 million, to £7,116 million, while fees
and commissions payable increased by 4%, £81 million to
£1,922 million.
Income from trading activities, which primarily arises from
providing customers with debt and risk management products
in interest rate, currency and credit, was up £332 million, 14%,
reflecting increased customer volumes.
Other operating income increased by 36%, £944 million to
£3,564 million. This was principally due to growth in income
from rental and asset-backed activities and principal
investments in Corporate Markets.
General insurance premium income, after reinsurance, rose by
3%, or £194 million to £5,973 million with good growth in motor
policies in the UK and Continental Europe.