RBS 2007 Annual Report Download - page 194
Download and view the complete annual report
Please find page 194 of the 2007 RBS annual report below. You can navigate through the pages in the report by either clicking on the pages listed below, or by using the keyword search tool below to find specific information within the annual report.-
 1
1 -
2
-
3
-
4
-
5
-
6
-
7
-
8
-
9
-
10
-
11
-
12
-
13
-
14
-
15
-
16
-
17
-
18
-
19
-
20
-
21
-
22
-
23
-
24
-
25
-
26
-
27
-
28
-
29
-
30
-
31
-
32
-
33
-
34
-
35
-
36
-
37
-
38
-
39
-
40
-
41
-
42
-
43
-
44
-
45
-
46
-
47
-
48
-
49
-
50
-
51
-
52
-
53
-
54
-
55
-
56
-
57
-
58
-
59
-
60
-
61
-
62
-
63
-
64
-
65
-
66
-
67
-
68
-
69
-
70
-
71
-
72
-
73
-
74
-
75
-
76
-
77
-
78
-
79
-
80
-
81
-
82
-
83
-
84
-
85
-
86
-
87
-
88
-
89
-
90
-
91
-
92
-
93
-
94
-
95
-
96
-
97
-
98
-
99
-
100
-
101
-
102
-
103
-
104
-
105
-
106
-
107
-
108
-
109
-
110
-
111
-
112
-
113
-
114
-
115
-
116
-
117
-
118
-
119
-
120
-
121
-
122
-
123
-
124
-
125
-
126
-
127
-
128
-
129
-
130
-
131
-
132
-
133
-
134
-
135
-
136
-
137
-
138
-
139
-
140
-
141
-
142
-
143
-
144
-
145
-
146
-
147
-
148
-
149
-
150
-
151
-
152
-
153
-
154
-
155
-
156
-
157
-
158
-
159
-
160
-
161
-
162
-
163
-
164
-
165
-
166
-
167
-
168
-
169
-
170
-
171
-
172
-
173
-
174
-
175
-
176
-
177
-
178
-
179
-
180
-
181
-
182
-
183
-
 184
184 -
 185
185 -
 186
186 -
 187
187 -
 188
188 -
 189
189 -
 190
190 -
 191
191 -
 192
192 -
 193
193 -
 194
194 -
 195
195 -
 196
196 -
 197
197 -
 198
198 -
 199
199 -
 200
200 -
 201
201 -
 202
202 -
 203
203 -
 204
204 -
205
-
206
-
207
-
208
-
209
-
210
-
211
-
212
-
213
-
214
-
215
-
216
-
217
-
218
-
219
-
220
-
221
-
222
-
223
-
224
-
225
-
226
-
227
-
228
-
229
-
230
-
231
-
232
-
233
-
234
-
235
-
236
-
237
-
238
-
239
-
240
-
241
-
242
-
243
-
244
-
245
-
246
-
247
-
248
-
249
-
250
-
251
-
252
 |
 |

Financial statements
RBS Group • Annual Report and Accounts 2007
192
Notes on the accounts continued
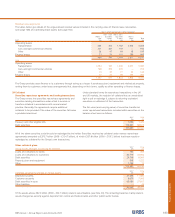
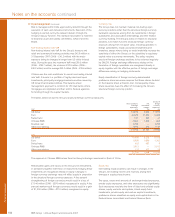
Market risk
Market risk is defined as the risk of loss resulting from adverse
changes in risk factors such as interest rates, foreign currency
and equity prices together with related factors such as market
volatilities.
The Group is exposed to market risk because of positions held
in its trading portfolios as well as its non-trading business
including the Group’s treasury operations.
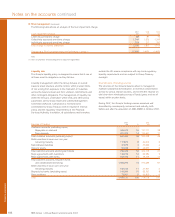
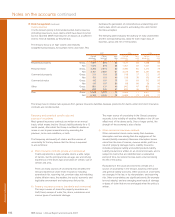
Value-at-risk (“VaR”)
VaR is a technique that produces estimates of the potential
negative change in the market value of a portfolio over a
specified time horizon at given confidence levels. For internal
risk management purposes, the Group’s VaR assumes a time
horizon of one trading day and a confidence level of 95%. The
Group uses historical simulation models in computing VaR. This
approach, in common with many other VaR models, assumes
that risk factor changes observed in the past are a good
estimate of those likely to occur in the future and is, therefore,
limited by the relevance of the historical data used. The Group’s
method, however, does not make any assumption about the
nature or type of underlying loss distribution. The Group
typically uses the previous 500 trading days of market data.
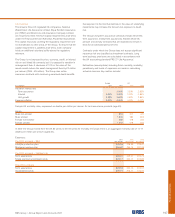
The Group calculates both general market risk (i.e. the risk due
to movement in general market benchmarks) and idiosyncratic
market risk (i.e. the risk due to movements in the value of
securities by reference to specific issuers) using its VaR models.
The Group’s VaR should be interpreted in light of the
limitations of the methodology used. These limitations include:
•Historical data may not provide the best estimate of the
joint distribution of risk factor changes in the future and
may fail to capture the risk of possible extreme adverse
market movements which have not occurred in the
historical window used in the calculations.
•VaR using a one-day time horizon does not fully capture
the market risk of positions that cannot be liquidated or
hedged within one day.
•VaR using a 95% confidence level does not reflect the
extent of potential losses beyond that percentile.
The Group largely computes the VaR of trading portfolios at
the close of business and positions may change substantially
during the course of the trading day. Further controls are in
place to limit the Group’s intra-day exposure; such as the
calculation of the VaR for selected portfolios. These limitations
and the nature of the VaR measure mean that the Group
cannot guarantee that losses will not exceed the VaR amounts
indicated. The Group undertakes stress testing to identify the
potential for losses in excess of VaR.
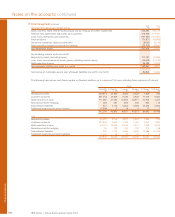
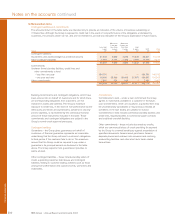
31 Risk management (continued)
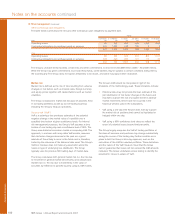
Other contractual cash obligations
The table below summarises the Group’s other contractual cash obligations by payment date.
Group
0-3 months 3-12 months 1-3 years 3-5 years 5-10 years 10-20 years
2007 £m £m £m £m £m £m
Operating leases 90 268 655 569 1,060 1,958
Contractual obligations to purchase goods or services 441 1,007 748 199 5 2
531 1,275 1,403 768 1,065 1,960
2006
Operating leases 85 254 624 533 804 1,073
Contractual obligations to purchase goods or services 378 449 969 101 114 39
463 703 1,593 634 918 1,112
The Group’s undrawn formal facilities, credit lines and other commitments to lend were £335,688 million (2006 – £242,655 million).
While the Group has given commitments to provide these funds, some facilities may be subject to certain conditions being met by
the counterparty. The Group does not expect all facilities to be drawn, and some may lapse before drawdown.