RBS 2007 Annual Report Download - page 42
Download and view the complete annual report
Please find page 42 of the 2007 RBS annual report below. You can navigate through the pages in the report by either clicking on the pages listed below, or by using the keyword search tool below to find specific information within the annual report.-
 1
1 -
2
-
3
-
4
-
5
-
6
-
7
-
8
-
9
-
10
-
11
-
12
-
13
-
14
-
15
-
16
-
17
-
18
-
19
-
20
-
21
-
22
-
23
-
24
-
25
-
26
-
27
-
28
-
29
-
30
-
31
-
 32
32 -
 33
33 -
 34
34 -
 35
35 -
 36
36 -
 37
37 -
 38
38 -
 39
39 -
 40
40 -
 41
41 -
 42
42 -
 43
43 -
 44
44 -
 45
45 -
 46
46 -
 47
47 -
 48
48 -
 49
49 -
 50
50 -
 51
51 -
 52
52 -
53
-
54
-
55
-
56
-
57
-
58
-
59
-
60
-
61
-
62
-
63
-
64
-
65
-
66
-
67
-
68
-
69
-
70
-
71
-
72
-
73
-
74
-
75
-
76
-
77
-
78
-
79
-
80
-
81
-
82
-
83
-
84
-
85
-
86
-
87
-
88
-
89
-
90
-
91
-
92
-
93
-
94
-
95
-
96
-
97
-
98
-
99
-
100
-
101
-
102
-
103
-
104
-
105
-
106
-
107
-
108
-
109
-
110
-
111
-
112
-
113
-
114
-
115
-
116
-
117
-
118
-
119
-
120
-
121
-
122
-
123
-
124
-
125
-
126
-
127
-
128
-
129
-
130
-
131
-
132
-
133
-
134
-
135
-
136
-
137
-
138
-
139
-
140
-
141
-
142
-
143
-
144
-
145
-
146
-
147
-
148
-
149
-
150
-
151
-
152
-
153
-
154
-
155
-
156
-
157
-
158
-
159
-
160
-
161
-
162
-
163
-
164
-
165
-
166
-
167
-
168
-
169
-
170
-
171
-
172
-
173
-
174
-
175
-
176
-
177
-
178
-
179
-
180
-
181
-
182
-
183
-
184
-
185
-
186
-
187
-
188
-
189
-
190
-
191
-
192
-
193
-
194
-
195
-
196
-
197
-
198
-
199
-
200
-
201
-
202
-
203
-
204
-
205
-
206
-
207
-
208
-
209
-
210
-
211
-
212
-
213
-
214
-
215
-
216
-
217
-
218
-
219
-
220
-
221
-
222
-
223
-
224
-
225
-
226
-
227
-
228
-
229
-
230
-
231
-
232
-
233
-
234
-
235
-
236
-
237
-
238
-
239
-
240
-
241
-
242
-
243
-
244
-
245
-
246
-
247
-
248
-
249
-
250
-
251
-
252
 |
 |

RBS Group • Annual Report and Accounts 2007
40
Business review continued
Business review
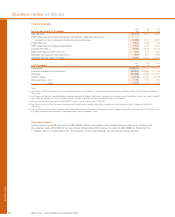
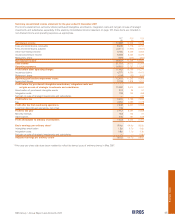
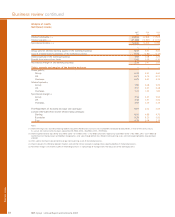
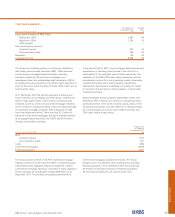
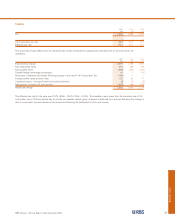
Average balance sheet and related interest
2005
Average
balance Interest Rate
£m £m %
Assets
Treasury bills and other eligible bills – UK 3,160 138 4.37
– Overseas 63 2 3.17
Loans and advances to banks – UK 15,338 649 4.23
– Overseas 9,465 308 3.25
Loans and advances to customers – UK 212,991 13,510 6.34
– Overseas 104,594 5,207 4.98
Debt securities – UK 15,553 697 4.48
– Overseas 22,526 994 4.41
Total interest-earning assets – banking business (2, 3) 383,690 21,505 5.60
– trading business (4) 172,990
Total interest-earning assets 556,680
Non-interest-earning assets (2, 3)180,368
Total assets 737,048
Percentage of assets applicable to overseas operations 35.3%
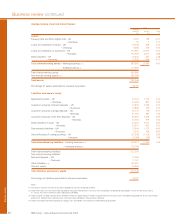
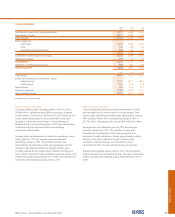
Liabilities and owners’ equity
Deposits by banks – UK 34,742 1,192 3.43
– Overseas 27,383 891 3.25
Customer accounts: demand deposits – UK 73,653 2,056 2.79
– Overseas 13,858 299 2.16
Customer accounts: savings deposits – UK 26,727 778 2.91
– Overseas 21,700 381 1.76
Customer accounts: other time deposits – UK 60,454 2,328 3.85
– Overseas 32,024 979 3.06
Debt securities in issue – UK 52,672 2,071 3.93
– Overseas 19,621 633 3.23
Subordinated liabilities – UK 23,948 1,122 4.69
– Overseas 2,642 154 5.83
Internal funding of trading business – UK (37,628) (1,125) 2.99
– Overseas (2,186) (39) 1.78
Total interest-bearing liabilities – banking business (2, 3) 349,610 11,720 3.35
– trading business (4) 172,744
Total interest-bearing liabilities 522,354
Non-interest-bearing liabilities
Demand deposits – UK 17,484
– Overseas 11,181
Other liabilities (3, 4) 153,081
Owners’ equity 32,948
Total liabilities and owners’ equity 737,048
Percentage of liabilities applicable to overseas operations 33.5%
Notes:
(1) The analysis into UK and Overseas has been compiled on the basis of location of office.
(2) Interest-earning assets and interest-bearing liabilities exclude the Retail bancassurance assets and liabilities attributable to policyholders, in view of their distinct nature.
As a result, net interest income has been adjusted by £59 million.
(3) Interest income has been adjusted by £115 million and interest expense by £307 million to record interest on financial assets and liabilities designated as at fair value through
profit or loss. Related interest-earning assets and interest-bearing liabilities have also been adjusted.
(4) Interest receivable and interest payable on trading assets and liabilities are included in income from trading activities.