Toyota 2012 Annual Report Download - page 102
Download and view the complete annual report
Please find page 102 of the 2012 Toyota annual report below. You can navigate through the pages in the report by either clicking on the pages listed below, or by using the keyword search tool below to find specific information within the annual report.-
 1
1 -
2
-
3
-
4
-
5
-
6
-
7
-
8
-
9
-
10
-
11
-
12
-
13
-
14
-
15
-
16
-
17
-
18
-
19
-
20
-
21
-
22
-
23
-
24
-
25
-
26
-
27
-
28
-
29
-
30
-
31
-
32
-
33
-
34
-
35
-
36
-
37
-
38
-
39
-
40
-
41
-
42
-
43
-
44
-
45
-
46
-
47
-
48
-
49
-
50
-
51
-
52
-
53
-
54
-
55
-
56
-
57
-
58
-
59
-
60
-
61
-
62
-
63
-
64
-
65
-
66
-
67
-
68
-
69
-
70
-
71
-
72
-
73
-
74
-
75
-
76
-
77
-
78
-
79
-
80
-
81
-
82
-
83
-
84
-
85
-
86
-
87
-
88
-
89
-
90
-
91
-
 92
92 -
 93
93 -
 94
94 -
 95
95 -
 96
96 -
 97
97 -
 98
98 -
 99
99 -
 100
100 -
 101
101 -
 102
102 -
 103
103 -
 104
104 -
 105
105 -
 106
106 -
 107
107 -
 108
108 -
 109
109 -
 110
110 -
 111
111 -
 112
112 -
113
-
114
-
115
-
116
-
117
-
118
-
119
-
120
-
121
-
122
-
123
-
124
-
125
-
126
-
127
 |
 |
TOYOTA ANNUAL REPORT 2012
Toyota Global Vision Changes for Making
Ever-Better Cars President
ʼ
s Message Medium- to Long-Term
Growth Initiatives Special Feature Management and
Corporate Information Investor Information
Business and
Performance Review Financial Section
Notes to Consolidated Financial Statements
Stock-based compensation: 18
In June 1997, the parent company
ʼ
s shareholders
approved a stock option plan for board members.
In June 2001, the shareholders approved an
amendment of the plan to include both board
members and key employees. Each year until
June 2010, since the plans
ʼ
inception, the
shareholders have approved the authorization for
the grant of options for the purchase of Toyota
ʼ
s
common stock. Authorized shares for each year
that remain ungranted are unavailable for grant
in future years. Stock options granted in and
after August 2006 have terms of 8 years and an
exercise price equal to 1.025 times the closing
price of Toyota
ʼ
s common stock on the date of
grant. These options generally vest 2 years from
the date of grant.
For the years ended March 31, 2010, 2011 and
2012, Toyota recognized stock-based compensation
expenses for stock options of ¥2,446 million, ¥2,522
million and ¥1,539 million
(
$19 million
)
as selling,
general and administrative expenses.
The weighted-average grant-date fair value
of options granted during the years ended March
31, 2010 and 2011 was ¥803 and ¥724, respectively
per share. The fair value of options granted
is amortized over the option vesting period in
determining net income attributable to Toyota
Motor Corporation in the consolidated statements
of income. The grant-date fair value of options
granted is estimated using the Black-Scholes
option pricing model with the following weighted-
average assumptions:
The total intrinsic value of options exercised
for the year ended March 31, 2010 was ¥113
million. No options were exercised for the years
ended March 31, 2011 and 2012.
As of March 31, 2012, there were unrecognized
compensation expenses of ¥264 million
(
$3
million
)
for stock options granted. Those expenses
are expected to be recognized over a weighted-
average period of 0.3 years.
Cash received from the exercise of stock
options for the year ended March 31, 2010 was
¥492 million. No cash was received from the
exercise of stock options for the years ended
March 31, 2011 and 2012.
2010 2011
Dividend rate 2.4% 1.5%
Risk-free interest rate 0.7% 0.3%
Expected volatility 30% 32%
Expected holding period
(
years
)
5.0 5.0
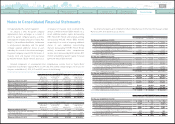
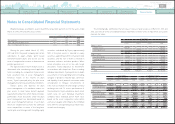
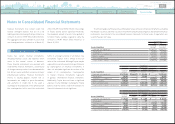
The following table summarizes Toyota
ʼ
s stock option activity:
Yen Yen in millions
Number of
shares
Weighted-average
exercise price
Weighted-average
remaining contractual
life in years
Aggregate
intrinsic value
Options outstanding at March 31, 2009 11,340,700 ¥ 5,631 5.51 ¥ 1
Granted 3,492,000 4,193
Exercised
(
157,800
)
3,116
Canceled
(
958,200
)
4,646
Options outstanding at March 31, 2010 13,716,700 5,363 5.23 ¥
—
Granted 3,435,000 3,183
Exercised
—
—
Canceled
(
1,364,900
)
4,759
Options outstanding at March 31, 2011 15,786,800 4,941 5.04 ¥ 565
Granted
—
—
Exercised
—
—
Canceled
(
3,256,800
)
5,059
Options outstanding at March 31, 2012 12,530,000 ¥4,910 4.55 ¥ 1,065
Options exercisable at March 31, 2010 7,515,700 ¥ 6,132 3.86 ¥
—
Options exercisable at March 31, 2011 9,347,800 ¥ 5,821 3.79 ¥
—
Options exercisable at March 31, 2012 9,778,000 ¥ 5,396 4.05 ¥
—
The following table summarizes information for options outstanding and options exercisable at March
31, 2012:
Outstanding Exercisable
Exercise price
range Number of
shares
Weighted-average
exercise price
Weighted-average
remaining life
Number of
shares
Weighted-average
exercise price
Yen Yen
U.S. dollars
Years Yen
U.S. dollars
¥3,183–5,000 8,526,000 ¥ 4,038 $49 5.34 5,774,000 ¥ 4,445 $54
5,001–7,278 4,004,000 6,766 82 2.88 4,004,000 6,766 82
3,183–7,278 12,530,000 4,910 60 4.55 9,778,000 5,396 66
0820
Search NextPrev page 102
Contents