Toyota 2012 Annual Report Download - page 51
Download and view the complete annual report
Please find page 51 of the 2012 Toyota annual report below. You can navigate through the pages in the report by either clicking on the pages listed below, or by using the keyword search tool below to find specific information within the annual report.-
 1
1 -
2
-
3
-
4
-
5
-
6
-
7
-
8
-
9
-
10
-
11
-
12
-
13
-
14
-
15
-
16
-
17
-
18
-
19
-
20
-
21
-
22
-
23
-
24
-
25
-
26
-
27
-
28
-
29
-
30
-
31
-
32
-
33
-
34
-
35
-
36
-
37
-
38
-
39
-
40
-
 41
41 -
 42
42 -
 43
43 -
 44
44 -
 45
45 -
 46
46 -
 47
47 -
 48
48 -
 49
49 -
 50
50 -
 51
51 -
 52
52 -
 53
53 -
 54
54 -
 55
55 -
 56
56 -
 57
57 -
 58
58 -
 59
59 -
 60
60 -
 61
61 -
62
-
63
-
64
-
65
-
66
-
67
-
68
-
69
-
70
-
71
-
72
-
73
-
74
-
75
-
76
-
77
-
78
-
79
-
80
-
81
-
82
-
83
-
84
-
85
-
86
-
87
-
88
-
89
-
90
-
91
-
92
-
93
-
94
-
95
-
96
-
97
-
98
-
99
-
100
-
101
-
102
-
103
-
104
-
105
-
106
-
107
-
108
-
109
-
110
-
111
-
112
-
113
-
114
-
115
-
116
-
117
-
118
-
119
-
120
-
121
-
122
-
123
-
124
-
125
-
126
-
127
 |
 |

TOYOTA ANNUAL REPORT 2012
Toyota Global Vision Changes for Making
Ever-Better Cars President
ʼ
s Message Medium- to Long-Term
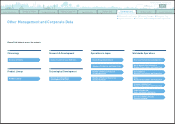
Growth Initiatives Special Feature Management and
Corporate Information Investor Information
Business and
Performance Review Financial Section
Management's Discussion and Analysis of Financial Condition and Results of Operations
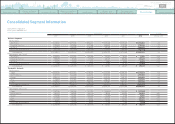
The following table provides information regarding Toyota
ʼ
s finance receivables and operating
leases in the past two fiscal years.
Yen in millions
March 31,
2011 2012
Finance Receivables
Retail ¥ 7,128,453 ¥ 7,248,793
Finance leases 1,123,188 955,430
Wholesale and other dealer loans 1,990,557 2,033,954
10,242,198 10,238,177
Deferred origination costs 104,391 105,533
Unearned income
(
496,235
)(
494,123
)
Allowance for credit losses
Retail
(
92,199
)(
77,353
)
Finance leases
(
36,024
)(
30,637
)
Wholesale and other dealer loans
(
28,580
)(
24,238
)
(
156,803
)(
132,228
)
Total finance receivables, net 9,693,551 9,717,359
Less – Current portion
(
4,136,805
)(
4,114,897
)
Noncurrent finance receivables, net ¥ 5,556,746 ¥ 5,602,462
Operating Leases
Vehicles ¥ 2,404,032 ¥ 2,487,721
Equipment 87,914 87,632
2,491,946 2,575,353
Less – Accumulated depreciation
(
651,443
)(
667,406
)
Less – Allowance for credit losses
(
10,812
)(
8,135
)
Vehicles and equipment on operating leases, net ¥ 1,829,691 ¥ 1,899,812
The fluctuations in funding costs can affect
the profitability of Toyota
ʼ
s financial services
operations. Funding costs are affected by a
number of factors, some of which are not in
Toyota
ʼ
s control. These factors include general
economic conditions, prevailing interest rates
and Toyota
ʼ
s financial strength. Funding costs
decreased during fiscal 2011 and 2012, mainly as
a result of lower interest rates.
Toyota launched its credit card business
in Japan in April 2001. As of March 31, 2011,
Toyota had 8.9 million cardholders, an increase
of 1.2 million cardholders compared with March
31, 2010. As of March 31, 2012, Toyota had 10.9
million cardholders, an increase of 2.0 million
cardholders compared with March 31, 2011.
The credit card receivables at March 31, 2011
increased by ¥8.1 billion from March 31, 2010
to ¥263.5 billion. The credit card receivables at
March 31, 2012 increased by ¥44.0 billion from
March 31, 2011 to ¥307.5 billion.
Toyota
ʼ
s other business operations consist of
housing including the manufacture and sale of
prefabricated homes, information technology
related businesses including information
technology and telecommunications, intelligent
transport systems and GAZOO, and other
businesses.
Toyota does not expect its other business
operations to materially contribute to Toyota
ʼ
s
consolidated results of operations.
Toyota
ʼ
s finance receivables are subject to
collectability risks. These risks include consumer
and dealer insolvencies and insufficient collateral
values
(
less costs to sell
)
to realize the full carrying
values of these receivables. See discussion in
“
Critical Accounting Estimates
—
Allowance for
Doubtful Accounts and Credit Losses
”
and note
11 to the consolidated financial statements.
Toyota continues to originate leases to finance
new Toyota vehicles. These leasing activities are
subject to residual value risk. Residual value
losses could be incurred when the lessee of a
vehicle does not exercise the option to purchase
the vehicle at the end of the lease term. See
discussion in
“
Critical Accounting Estimates
—
Investment in Operating Leases
”
and note 2 to the
consolidated financial statements.
Toyota enters into interest rate swap
agreements and cross currency interest rate
swap agreements to convert its fixed-rate debt to
variable-rate functional currency debt. A portion
of the derivative instruments are entered into
to hedge interest rate risk from an economic
perspective and are not designated as a hedge
of specific assets or liabilities on Toyota
ʼ
s
consolidated balance sheet and accordingly,
unrealized gains or losses related to derivatives
that are not designated as a hedge are recognized
currently in operations. See discussion in
“
Critical
Accounting Estimates
—
Derivatives and Other
Contracts at Fair Value
”
and
“
Quantitative and
Qualitative Disclosures about Market Risk
”
and
note 20 to the consolidated financial statements.
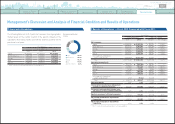
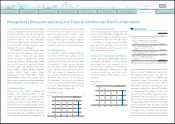
‘12‘09 ‘10
‘08
‘11
0
(¥ Billion)
4,000
8,000
12,0 0 0
16,0 00
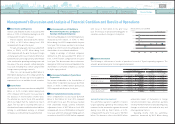
Total Assets by Financial Services Operations
■
Other Business Operations
0820
Search NextPrev page 51
Contents