Toyota 2012 Annual Report Download - page 58
Download and view the complete annual report
Please find page 58 of the 2012 Toyota annual report below. You can navigate through the pages in the report by either clicking on the pages listed below, or by using the keyword search tool below to find specific information within the annual report.-
 1
1 -
2
-
3
-
4
-
5
-
6
-
7
-
8
-
9
-
10
-
11
-
12
-
13
-
14
-
15
-
16
-
17
-
18
-
19
-
20
-
21
-
22
-
23
-
24
-
25
-
26
-
27
-
28
-
29
-
30
-
31
-
32
-
33
-
34
-
35
-
36
-
37
-
38
-
39
-
40
-
41
-
42
-
43
-
44
-
45
-
46
-
47
-
 48
48 -
 49
49 -
 50
50 -
 51
51 -
 52
52 -
 53
53 -
 54
54 -
 55
55 -
 56
56 -
 57
57 -
 58
58 -
 59
59 -
 60
60 -
 61
61 -
 62
62 -
 63
63 -
 64
64 -
 65
65 -
 66
66 -
 67
67 -
 68
68 -
69
-
70
-
71
-
72
-
73
-
74
-
75
-
76
-
77
-
78
-
79
-
80
-
81
-
82
-
83
-
84
-
85
-
86
-
87
-
88
-
89
-
90
-
91
-
92
-
93
-
94
-
95
-
96
-
97
-
98
-
99
-
100
-
101
-
102
-
103
-
104
-
105
-
106
-
107
-
108
-
109
-
110
-
111
-
112
-
113
-
114
-
115
-
116
-
117
-
118
-
119
-
120
-
121
-
122
-
123
-
124
-
125
-
126
-
127
 |
 |

TOYOTA ANNUAL REPORT 2012
Toyota Global Vision Changes for Making
Ever-Better Cars President
ʼ
s Message Medium- to Long-Term
Growth Initiatives Special Feature Management and
Corporate Information Investor Information
Business and
Performance Review Financial Section
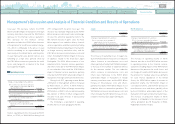
Management's Discussion and Analysis of Financial Condition and Results of Operations
The following is a description of operating
income and loss in each geographic market.
billion impact of cost reduction efforts, partially
offset by the ¥10.0 billion decrease in operating
income in the financial services operations.
During fiscal 2012, operating loss
(
before
elimination of intersegment profits
)
, decreased
by ¥155.3 billion in Japan compared with the prior
fiscal year. During fiscal 2012, operating income
(
before elimination of intersegment profits
)
,
increased by ¥4.6 billion, or 35.4%, in Europe
compared with the prior fiscal year, whereas it
decreased by ¥153.0 billion, or 45.1%, in North
America, decreased by ¥56.2 billion, or 18.0%, in
Asia, and decreased by ¥51.3 billion, or 32.0%, in
Other.
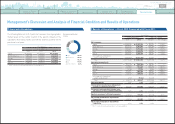
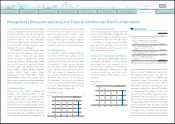
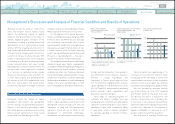
Operating Income
(
Loss
)
(¥ Billion) (%)
% of net revenues
(Right scale)
0
500
-500
1,000
1,500
2,000
2,500 20
16
12
8
4
0
-4
‘12‘09 ‘10
‘08
‘11
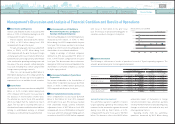
Japan
Yen in millions
2012 vs. 2011
Change
Changes in operating income and loss:
Effect of changes in vehicle unit sales
and sales mix and other operational
factors ¥ 195,000
Effect of fluctuation in foreign
currency translation rates and
others
(
275,000
)
Effect of cost reduction efforts,
decrease in miscellaneous costs
and others 235,356
Total ¥ 155,356
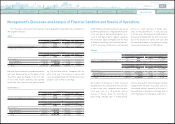
North America
Yen in millions
2012 vs. 2011
Change
Changes in operating income and loss:
Effect of changes in vehicle unit sales
and sales mix and other operational
factors ¥
(
5,000
)
Effect of fluctuation in foreign
currency translation rates and
others
(
7,500
)
Effect of cost reduction efforts,
increase in miscellaneous costs
and others
(
140,594
)
Total ¥
(
153,094
)
Europe
Yen in millions
2012 vs. 2011
Change
Changes in operating income and loss:
Effect of changes in vehicle unit sales
and sales mix and other operational
factors ¥
(
15,000
)
Effect of fluctuation in foreign
currency translation rates and
others
(
1,200
)
Effect of cost reduction efforts,
decrease in miscellaneous costs
and others 20,848
Total ¥ 4,648
The decrease in operating losses in Japan reflects
the ¥195.0 billion of favorable impact by changes
in vehicle unit sales and sales mix and other
operational factors and ¥235.3 billion impact
of the cost reduction efforts, and decrease in
miscellaneous costs and others, partially offset
by the ¥275.0 billion unfavorable impact of effect
of fluctuation in foreign currency transaction
rates and others. The cost reduction efforts,
decrease in miscellaneous costs and others
mainly reflect the ¥130.0 billion impact of the cost
reduction efforts and ¥40.0 billion decrease in
miscellaneous costs and others. The increase in
vehicle unit sales was mainly due to introduction
of new products such as Prius
α
and Aqua.
The decrease in operating income in North
America was due to the ¥55.0 billion decrease
in operating income in the financial services
operations, the ¥7.5 billion unfavorable impact of
the fluctuations in foreign currency translation
rates and others, the ¥5.0 billion negative impact
of changes in vehicle unit sales and sales mix and
other operational factors and the ¥90.0 billion
increase in miscellaneous costs and others.
The increase in operating income in Europe was
due to the ¥10.0 billion impact of cost reduction
efforts and the ¥5.0 billion increase in operating
income in the financial services operations,
partially offset by ¥15.0 billion negative impact
of changes in vehicle unit sales and sales mix
and other operational factors and the ¥1.2 billion
unfavorable impact of fluctuations in foreign
currency translation rates and others.
The decrease in operating income in Asia
was due to the ¥10.0 billion negative impact of
changes in vehicle unit sales and sales mix and
other operational factors and others and the
¥35.0 billion increase in miscellaneous costs
and others, partially offset by the ¥11.6 billion
favorable impact of the fluctuation in foreign
currency translation rates and others.
Asia
Yen in millions
2012 vs. 2011
Change
Changes in operating income and loss:
Effect of changes in vehicle unit sales
and sales mix and other operational
factors ¥
(
10,000
)
Effect of fluctuation in foreign
currency translation rates and
others 11,600
Effect of cost reduction efforts,
increase in miscellaneous costs
and others
(
57,787
)
Total ¥
(
56,187
)
0820
Search NextPrev page 58
Contents