Toyota 2012 Annual Report Download - page 88
Download and view the complete annual report
Please find page 88 of the 2012 Toyota annual report below. You can navigate through the pages in the report by either clicking on the pages listed below, or by using the keyword search tool below to find specific information within the annual report.-
 1
1 -
2
-
3
-
4
-
5
-
6
-
7
-
8
-
9
-
10
-
11
-
12
-
13
-
14
-
15
-
16
-
17
-
18
-
19
-
20
-
21
-
22
-
23
-
24
-
25
-
26
-
27
-
28
-
29
-
30
-
31
-
32
-
33
-
34
-
35
-
36
-
37
-
38
-
39
-
40
-
41
-
42
-
43
-
44
-
45
-
46
-
47
-
48
-
49
-
50
-
51
-
52
-
53
-
54
-
55
-
56
-
57
-
58
-
59
-
60
-
61
-
62
-
63
-
64
-
65
-
66
-
67
-
68
-
69
-
70
-
71
-
72
-
73
-
74
-
75
-
76
-
77
-
 78
78 -
 79
79 -
 80
80 -
 81
81 -
 82
82 -
 83
83 -
 84
84 -
 85
85 -
 86
86 -
 87
87 -
 88
88 -
 89
89 -
 90
90 -
 91
91 -
 92
92 -
 93
93 -
 94
94 -
 95
95 -
 96
96 -
 97
97 -
 98
98 -
99
-
100
-
101
-
102
-
103
-
104
-
105
-
106
-
107
-
108
-
109
-
110
-
111
-
112
-
113
-
114
-
115
-
116
-
117
-
118
-
119
-
120
-
121
-
122
-
123
-
124
-
125
-
126
-
127
 |
 |
TOYOTA ANNUAL REPORT 2012
Toyota Global Vision Changes for Making
Ever-Better Cars President
ʼ
s Message Medium- to Long-Term
Growth Initiatives Special Feature Management and
Corporate Information Investor Information
Business and
Performance Review Financial Section
Notes to Consolidated Financial Statements
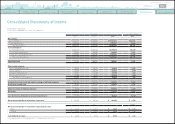
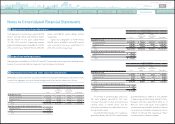
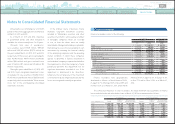
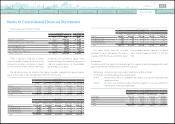
Marketable securities and other securities investments include government bonds and common stocks
for which the aggregate cost, gross unrealized gains and losses and fair value are as follows:
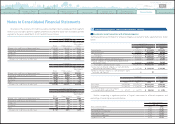
Supplemental cash flow information: 4
Acquisitions and dispositions: 5
Marketable securities and other securities investments: 6
million and ¥365,109 million
(
$4,442 million
)
,
respectively.
Capital lease obligations of ¥3,400 million,
¥10,478 million and ¥5,847 million
(
$71 million
)
were incurred for the years ended March 31,
2010, 2011 and 2012, respectively.
government bonds as of March 31, 2011, and 60%
of Japanese government bonds, and 40% of U.S.,
European and other government bonds as of
March 31, 2012. Listed stocks on the Japanese
stock markets represent 86% and 83% of common
stocks which are included in available-for-sale as
of March 31, 2011 and 2012, respectively.
“
Other
”
includes primarily commercial paper.
Cash payments for income taxes were ¥
(
207,278
)
million, ¥211,487 million and ¥282,440 million
(
$3,436 million
)
for the years ended March
31, 2010, 2011 and 2012, respectively. Interest
payments during the years ended March 31, 2010,
2011 and 2012 were ¥445,049 million, ¥382,903
The amount of unrealized gains and losses
that were originally reported for 2011 were
corrected. There was no effect on the disclosed
carrying values or market values and the
information included in the table above reflects
the adjustments made.
Government bonds include 77% of Japanese
government bonds, and 23% of U.S. and European
During the years ended March 31, 2010, 2011 and 2012, Toyota made several acquisitions and dispositions,
however the assets and liabilities acquired or transferred were not material.
Yen in millions
March 31, 2011
Cost
Gross
unrealized
gains
Gross
unrealized
losses Fair value
Available-for-sale
Government bonds ¥3,174,236 ¥ 21,712 ¥ 68,778 ¥3,127,170
Common stocks 670,405 336,598 46,774 960,229
Other 561,387 15,940 376 576,951
Total ¥4,406,028 ¥374,250 ¥115,928 ¥4,664,350
Securities not practicable to determine fair value
Common stocks ¥ 109,203
Other 23,069
Total ¥ 132,272
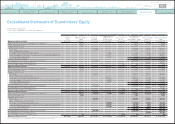
Yen in millions
March 31, 2012
Cost
Gross
unrealized
gains
Gross
unrealized
losses Fair value
Available-for-sale
Government bonds ¥ 3,580,574 ¥ 72,485 ¥ 51,147 ¥ 3,601,912
Common stocks 605,889 444,073 15,643 1,034,319
Other 475,109 21,846 11 496,944
Total ¥ 4,661,572 ¥ 538,404 ¥ 66,801 ¥ 5,133,175
Securities not practicable to determine fair value
Common stocks ¥ 79,420
Other 22,047
Total ¥ 101,467
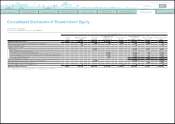
U.S. dollars in millions
March 31, 2012
Cost
Gross
unrealized
gains
Gross
unrealized
losses Fair value
Available-for-sale
Government bonds $ 43,564 $ 882 $ 622 $ 43,824
Common stocks 7,372 5,403 191 12,584
Other 5,781 266 0 6,047
Total $ 56,717 $ 6,551 $ 813 $ 62,455
Securities not practicable to determine fair value
Common stocks $ 967
Other 268
Total $ 1,235
0820
Search NextPrev page 88
Contents