Toyota 2012 Annual Report Download - page 83
Download and view the complete annual report
Please find page 83 of the 2012 Toyota annual report below. You can navigate through the pages in the report by either clicking on the pages listed below, or by using the keyword search tool below to find specific information within the annual report.-
 1
1 -
2
-
3
-
4
-
5
-
6
-
7
-
8
-
9
-
10
-
11
-
12
-
13
-
14
-
15
-
16
-
17
-
18
-
19
-
20
-
21
-
22
-
23
-
24
-
25
-
26
-
27
-
28
-
29
-
30
-
31
-
32
-
33
-
34
-
35
-
36
-
37
-
38
-
39
-
40
-
41
-
42
-
43
-
44
-
45
-
46
-
47
-
48
-
49
-
50
-
51
-
52
-
53
-
54
-
55
-
56
-
57
-
58
-
59
-
60
-
61
-
62
-
63
-
64
-
65
-
66
-
67
-
68
-
69
-
70
-
71
-
72
-
 73
73 -
 74
74 -
 75
75 -
 76
76 -
 77
77 -
 78
78 -
 79
79 -
 80
80 -
 81
81 -
 82
82 -
 83
83 -
 84
84 -
 85
85 -
 86
86 -
 87
87 -
 88
88 -
 89
89 -
 90
90 -
 91
91 -
 92
92 -
 93
93 -
94
-
95
-
96
-
97
-
98
-
99
-
100
-
101
-
102
-
103
-
104
-
105
-
106
-
107
-
108
-
109
-
110
-
111
-
112
-
113
-
114
-
115
-
116
-
117
-
118
-
119
-
120
-
121
-
122
-
123
-
124
-
125
-
126
-
127
 |
 |
TOYOTA ANNUAL REPORT 2012
Toyota Global Vision Changes for Making
Ever-Better Cars President
ʼ
s Message Medium- to Long-Term
Growth Initiatives Special Feature Management and
Corporate Information Investor Information
Business and
Performance Review Financial Section
Notes to Consolidated Financial Statements
expenses related to future recalls and other safety
measures. The estimation model for recalls and
other safety measures takes into account Toyota
ʼ
s
historical experience and individual occurrences
of recalls and other safety measures. This change
resulted from Toyota
ʼ
s fiscal 2010 experience with
recalls and other safety measures changes in the
operating processes such as the establishment
of the Special Committee for Global Quality to
address quality-related matters, as well as the
broadening of the number of vehicles subject to
recalls and other safety measures.
Litigation liabilities are established to cover
probable losses on various lawsuits based on the
information currently available. Attorneys
ʼ
fees
are expensed as incurred.
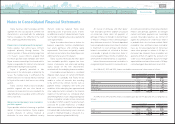
Research and development costs are
expensed as incurred. Research and development
costs were ¥725,345 million, ¥730,340 million
and ¥779,806 million
(
$9,488 million
)
for the
years ended March 31, 2010, 2011 and 2012,
respectively.
Cash and cash equivalents include all highly liquid
investments with original maturities of three
months or less, that are readily convertible to
known amounts of cash and are so near maturity
that they present insignificant risk of changes in
value because of changes in interest rates.
Marketable securities consist of debt and equity
information.
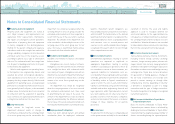
Finance receivables recorded on Toyota
ʼ
s balance
sheet are comprised of the unpaid principal
balance, plus accrued interest, less charge-
offs, net of any unearned income and deferred
origination costs and the allowance for credit
losses. Deferred origination costs are amortized
so as to approximate a level rate of return over
the term of the related contracts.
The determination of portfolio segments is
based primarily on the qualitative consideration
of the nature of Toyota
ʼ
s business operations and
finance receivables. The three portfolio segments
within finance receivables are as follows:
The retail receivables portfolio segment consists
of retail installment sales contracts acquired
mainly from dealers
(“
auto loans
”)
including
credit card loans. These contracts acquired must
first meet specified credit standards. Thereafter,
Toyota retains responsibility for contract
collection and administration.
The contract periods of auto loans primarily
range from 2 to 7 years. Toyota acquires security
interests in the vehicles financed and has the
right to repossess vehicles if customers fail to
meet their contractual obligations. Almost all
auto loans are non-recourse, which relieves the
dealers from financial responsibility in the event
of repossession.
¥304,375 million, ¥308,903 million and ¥304,713
million
(
$3,707 million
)
for the years ended March
31, 2010, 2011 and 2012, respectively.
Toyota generally warrants its products
against certain manufacturing and other defects.
Provisions for product warranties are provided
for specific periods of time and/or usage of the
product and vary depending upon the nature of
the product, the geographic location of the sale
and other factors. Toyota records a provision for
estimated product warranty costs at the time the
related sale is recognized based on estimates
that Toyota will incur to repair or replace product
parts that fail while under warranty. The amount
of accrued estimated warranty costs is primarily
based on historical experience as to product
failures as well as current information on repair
costs. The amount of warranty costs accrued
also contains an estimate of warranty claim
recoveries to be received from suppliers.
In addition to product warranties above, Toyota
accrues for costs of recalls and other safety
measures based on management
ʼ
s estimates
when it is probable a liability has been incurred and
the amount of loss can be reasonably estimated.
Prior to the fourth quarter of fiscal 2010, amounts
were accrued based on individual occurrences
of recalls and other safety measures. During
the fourth quarter of fiscal 2010, as a result of
significant changes in facts and circumstances,
Toyota has employed an estimation model, to
accrue at the time of vehicle sale, an amount
that represents management
ʼ
s best estimate of
securities. Debt and equity securities designated
as available-for-sale are carried at fair value
with unrealized gains or losses included as a
component of accumulated other comprehensive
income in shareholders
ʼ
equity, net of applicable
taxes. Individual securities classified as available-
for-sale are reduced to net realizable value for
other-than-temporary declines in market value.
In determining if a decline in value is other-than-
temporary, Toyota considers the length of
time and the extent to which the fair value has
been less than the carrying value, the financial
condition and prospects of the company and
Toyota
ʼ
s ability and intent to retain its investment
in the company for a period of time sufficient to
allow for any anticipated recovery in market value.
Realized gains and losses, which are determined
on the average-cost method, are reflected in the
statement of income when realized.
Security investments in non-public companies
are carried at cost as fair value is not readily
determinable. If the value of a non-public
security investment is estimated to have declined
and such decline is judged to be other-than-
temporary, Toyota recognizes the impairment of
the investment and the carrying value is reduced
to its fair value. Determination of impairment is
based on the consideration of such factors as
operating results, business plans and estimated
future cash flows. Fair value is determined
principally through the use of the latest financial
■
Cash and cash equivalents
■
Finance receivables
Retail receivables portfolio segment
■
Security investments in non-public companies
■
Marketable securities
0820
Search NextPrev page 83
Contents