Toyota 2012 Annual Report Download - page 95
Download and view the complete annual report
Please find page 95 of the 2012 Toyota annual report below. You can navigate through the pages in the report by either clicking on the pages listed below, or by using the keyword search tool below to find specific information within the annual report.-
 1
1 -
2
-
3
-
4
-
5
-
6
-
7
-
8
-
9
-
10
-
11
-
12
-
13
-
14
-
15
-
16
-
17
-
18
-
19
-
20
-
21
-
22
-
23
-
24
-
25
-
26
-
27
-
28
-
29
-
30
-
31
-
32
-
33
-
34
-
35
-
36
-
37
-
38
-
39
-
40
-
41
-
42
-
43
-
44
-
45
-
46
-
47
-
48
-
49
-
50
-
51
-
52
-
53
-
54
-
55
-
56
-
57
-
58
-
59
-
60
-
61
-
62
-
63
-
64
-
65
-
66
-
67
-
68
-
69
-
70
-
71
-
72
-
73
-
74
-
75
-
76
-
77
-
78
-
79
-
80
-
81
-
82
-
83
-
84
-
 85
85 -
 86
86 -
 87
87 -
 88
88 -
 89
89 -
 90
90 -
 91
91 -
 92
92 -
 93
93 -
 94
94 -
 95
95 -
 96
96 -
 97
97 -
 98
98 -
 99
99 -
 100
100 -
 101
101 -
 102
102 -
 103
103 -
 104
104 -
 105
105 -
106
-
107
-
108
-
109
-
110
-
111
-
112
-
113
-
114
-
115
-
116
-
117
-
118
-
119
-
120
-
121
-
122
-
123
-
124
-
125
-
126
-
127
 |
 |
TOYOTA ANNUAL REPORT 2012
Toyota Global Vision Changes for Making
Ever-Better Cars President
ʼ
s Message Medium- to Long-Term
Growth Initiatives Special Feature Management and
Corporate Information Investor Information
Business and
Performance Review Financial Section
Notes to Consolidated Financial Statements
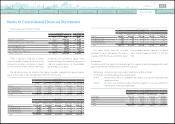
Certain affiliated companies accounted for
by the equity method with carrying amounts of
¥1,384,159 million and ¥1,467,575 million
(
$17,856
million
)
at March 31, 2011 and 2012, respectively,
were quoted on various established markets
at an aggregate value of ¥1,475,352 million and
¥1,477,413 million
(
$17,976 million
)
, respectively.
For the year ended March 31, 2010, Toyota
recognized an impairment loss on a certain
investment in affiliated company accounted for
by the equity method of ¥63,575 million, which
is included in
“
Equity in earnings of affiliated
Dividends from affiliated companies accounted
for by the equity method for the years ended
March 31, 2010, 2011 and 2012 were ¥82,149
million, ¥103,169 million and ¥122,950 million
(
$1,496 million
)
, respectively.
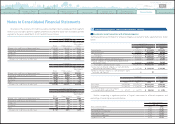
Toyota does not have any significant related
party transactions other than transactions with
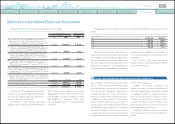
Although the finance receivables related to
securitization transactions have been legally sold
to the VIEs, Toyota has both the power to direct
the activities of the VIEs that most significantly
impact the VIEs
ʼ
economic performance and the
obligation to absorb losses of the VIEs or the
right to receive benefits from the VIEs that could
potentially be significant to the VIEs. As a result,
Toyota is considered the primary beneficiary of
the VIEs and therefore consolidates the VIEs.
The consolidated securitization VIEs have
¥1,111,212 million and ¥1,208,136 million
(
$14,699
million
)
in retail finance receivables, ¥64,502
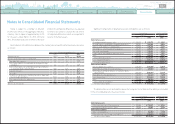
As of March 31, 2012,
“
Loans, principally from
banks
”
amount includes secured loans by finance
receivables securitization of ¥194,571 million
(
$2,367 million
)
.
As of March 31, 2012, Toyota has unused
short-term lines of credit amounting to ¥2,465,882
companies
”
in the accompanying consolidated
statements of income. Toyota evaluated its
investments in affiliated companies, considering
the length of time and the extent to which the
quoted market prices have been less than the
carrying amounts, the financial condition and
near-term prospects of the affiliated companies
and Toyota
ʼ
s ability and intent to retain those
investments in the companies for a period of
time. Toyota did not recognize any impairment
loss for the years ended March 31, 2011 and 2012.
affiliated companies in the ordinary course of
business.
Toyota enters into securitization transactions
using special-purpose entities, that are
considered variable interest entities
(“
VIEs
”)
.
million and ¥65,541 million
(
$797 million
)
in restricted cash and ¥941,613 million and
¥1,040,816 million
(
$12,664 million
)
in secured
debt as of March 31, 2011 and 2012, respectively.
Risks to which Toyota is exposed including credit,
interest rate, and/or prepayment risks are not
incremental compared with the situation before
Toyota enters into securitization transactions.
As for VIEs other than those specified above,
neither the aggregate size of these VIEs nor
Toyota
ʼ
s involvements in these VIEs are material
to Toyota
ʼ
s consolidated financial statements.
million
(
$30,002 million
)
of which ¥332,896
million
(
$4,050 million
)
related to commercial
paper programs. Under these programs, Toyota
is authorized to obtain short-term financing at
prevailing interest rates for periods not in excess
of 360 days.
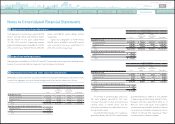
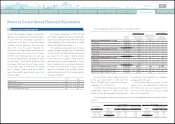
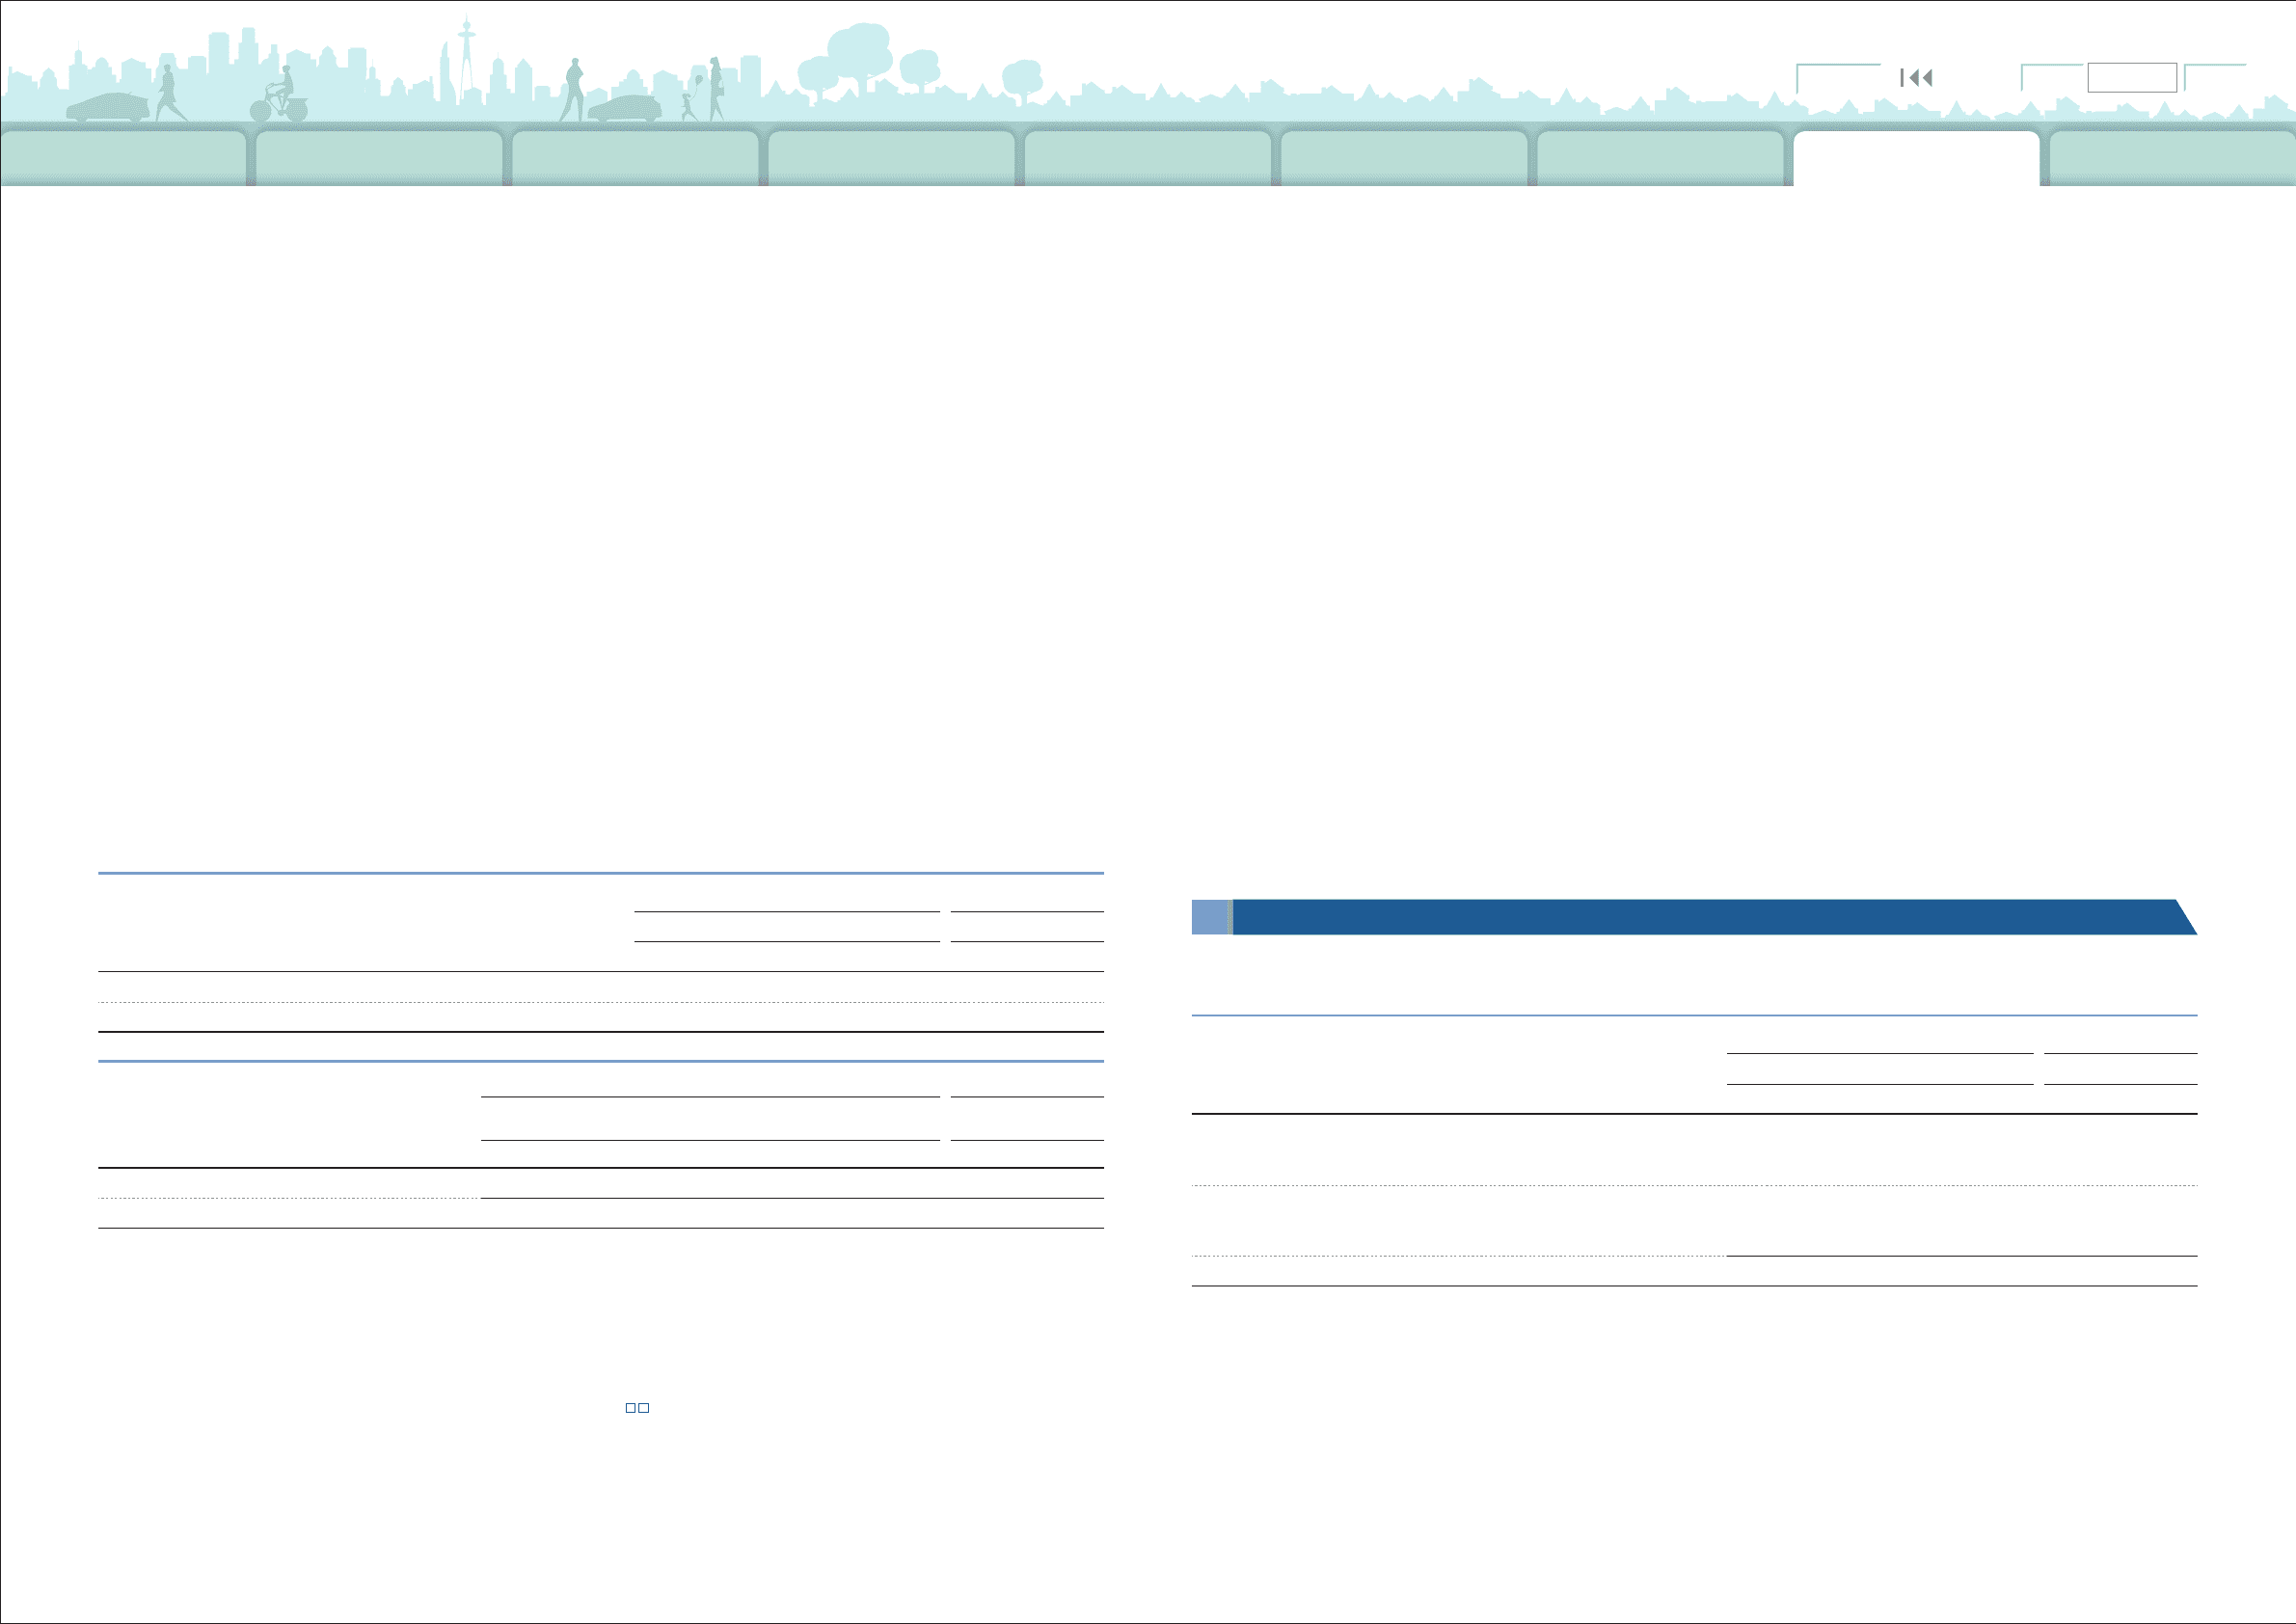
Account balances and transactions with affiliated companies are presented below:
Yen in millions
U.S. dollars in millions
March 31, March 31,
2011 2012 2012
Trade accounts and notes receivable, and other receivables ¥204,447 ¥ 283,497 $3,449
Accounts payable and other payables 352,538 707,955 8,614
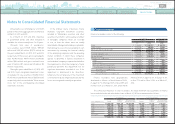
Yen in millions
U.S. dollars in millions
March 31, March 31,
2011 2012 2012
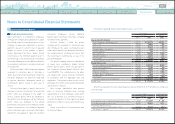
Loans, principally from banks, with a weighted-average
interest at March 31, 2011 and March 31, 2012 of 1.57% and
of 1.93% per annum, respectively ¥1,140,066 ¥ 1,158,556 $14,096
Commercial paper with a weighted-average interest at
March 31, 2011 and March 31, 2012 of 0.67% and of 0.72%
per annum, respectively 2,038,943 2,292,093 27,888
¥3,179,009 ¥ 3,450,649 $41,984
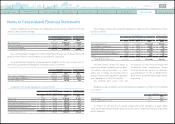
Yen in millions
U.S. dollars in millions
For the years ended March 31,
For the year ended
March 31,
2010 2011 2012 2012
Net revenues
¥1,600,365 ¥1,612,397 ¥ 1,536,326 $18,692
Purchases
3,943,648 3,655,185 3,785,284 46,055
■
Variable Interest Entities
Short-term borrowings and long-term debt: 13
Short-term borrowings at March 31, 2011 and 2012 consist of the following:
0820
Search NextPrev page 95
Contents