Toyota 2012 Annual Report Download - page 104
Download and view the complete annual report
Please find page 104 of the 2012 Toyota annual report below. You can navigate through the pages in the report by either clicking on the pages listed below, or by using the keyword search tool below to find specific information within the annual report.-
 1
1 -
2
-
3
-
4
-
5
-
6
-
7
-
8
-
9
-
10
-
11
-
12
-
13
-
14
-
15
-
16
-
17
-
18
-
19
-
20
-
21
-
22
-
23
-
24
-
25
-
26
-
27
-
28
-
29
-
30
-
31
-
32
-
33
-
34
-
35
-
36
-
37
-
38
-
39
-
40
-
41
-
42
-
43
-
44
-
45
-
46
-
47
-
48
-
49
-
50
-
51
-
52
-
53
-
54
-
55
-
56
-
57
-
58
-
59
-
60
-
61
-
62
-
63
-
64
-
65
-
66
-
67
-
68
-
69
-
70
-
71
-
72
-
73
-
74
-
75
-
76
-
77
-
78
-
79
-
80
-
81
-
82
-
83
-
84
-
85
-
86
-
87
-
88
-
89
-
90
-
91
-
92
-
93
-
 94
94 -
 95
95 -
 96
96 -
 97
97 -
 98
98 -
 99
99 -
 100
100 -
 101
101 -
 102
102 -
 103
103 -
 104
104 -
 105
105 -
 106
106 -
 107
107 -
 108
108 -
 109
109 -
 110
110 -
 111
111 -
 112
112 -
 113
113 -
 114
114 -
115
-
116
-
117
-
118
-
119
-
120
-
121
-
122
-
123
-
124
-
125
-
126
-
127
 |
 |

TOYOTA ANNUAL REPORT 2012
Toyota Global Vision Changes for Making
Ever-Better Cars President
ʼ
s Message Medium- to Long-Term
Growth Initiatives Special Feature Management and
Corporate Information Investor Information
Business and
Performance Review Financial Section
Notes to Consolidated Financial Statements
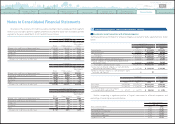
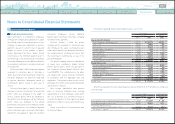
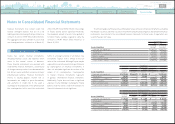
Amounts recognized in accumulated other comprehensive income
(
loss
)
as of March 31, 2011 and
2012 are comprised of the following:
Yen in millions
U.S. dollars in millions
March 31, March 31,
2011 2012 2012
Net actuarial loss ¥
(
347,494
)
¥
(
456,839
)
$
(
5,558
)
Prior service costs 72,324 55,597 676
Net transition obligation
(
1,626
)̶
̶
Net amount recognized ¥
(
276,796
)
¥
(
401,242
)
$
(
4,882
)
The accumulated benefit obligation for all defined benefit pension plans was ¥1,584,627 million and
¥1,764,721 million
(
$21,471 million
)
at March 31, 2011 and 2012, respectively.
The projected benefit obligation, accumulated benefit obligation and fair value of plan assets for
which the accumulated benefit obligations exceed plan assets are as follows:
Yen in millions
U.S. dollars in millions
March 31, March 31,
2011 2012 2012
Projected benefit obligation ¥500,046 ¥ 535,503 $ 6,515
Accumulated benefit obligation 453,111 481,484 5,858
Fair value of plan assets 72,359 80,752 983
The other amount includes the impact of
transition to defined contribution pension plans,
consolidation and deconsolidation of certain
entities due to changes in ownership interest
and currency translation adjustments during the
years ended March 31, 2010, 2011 and 2012.
The estimated prior service costs and
net actuarial loss that will be amortized from
accumulated other comprehensive income
(
loss
)
into net periodic pension cost during the
year ending March 31, 2013 are ¥
(
5,800
)
million
(
$
(
71
)
million
)
and ¥20,600 million
(
$251 million
)
,
respectively.
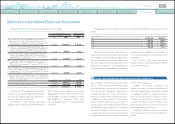
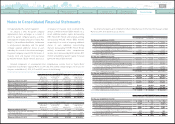
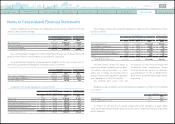
Components of the net periodic pension cost are as follows:
Yen in millions
U.S. dollars in millions
For the years ended March 31,
For the year ended
March 31,
2010 2011 2012 2012
Service cost ¥ 75,558 ¥ 82,422 ¥ 78,539 $ 956
Interest cost 50,559 52,502 52,399 637
Expected return on plan assets
(
32,251
)(
42,364
)(
44,422
) (
541
)
Amortization of prior service costs
(
15,063
)(
24,032
)(
15,975
) (
194
)
Recognized net actuarial loss 27,246 16,095 30,125 366
Amortization of net transition obligation 1,944 1,944 1,626 20
Net periodic pension cost ¥107,993 ¥ 86,567 ¥102,292 $1,244
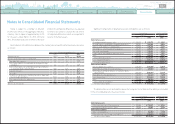
Other changes in plan assets and benefit obligations recognized in other comprehensive income
(
loss
)
are as follows:
Yen in millions
U.S. dollars in millions
For the years ended March 31,
For the year ended
March 31,
2010 2011 2012 2012
Net actuarial gain
(
loss
)
¥ 81,949 ¥
(
21,978
)
¥
(
145,433
)
$
(
1,770
)
Recognized net actuarial loss 27,246 16,095 30,125 366
Prior service costs 3,080 1,429
(
740
) (
9
)
Amortization of prior service costs
(
15,063
)(
24,032
)(
15,975
) (
194
)
Amortization of net transition obligation 1,944 1,944 1,626 20
Other 2,594 40,995 5,951 73
Total recognized in other
comprehensive income
(
loss
)
¥101,750 ¥ 14,453 ¥
(
124,446
)
$
(
1,514
)
Weighted-average assumptions used to determine benefit obligations as of March 31, 2011 and 2012
are as follows:
March 31,
2011 2012
Discount rate 2.8% 2.6%
Rate of compensation increase 2.6% 2.8%
As of March 31, 2011 and 2012, the parent company and certain subsidiaries in Japan employ
“
point
”
based retirement benefit plans and do not use the rates of compensation increase to determine
benefit obligations.
0820
Search NextPrev page 104
Contents