Toyota 2012 Annual Report Download - page 59
Download and view the complete annual report
Please find page 59 of the 2012 Toyota annual report below. You can navigate through the pages in the report by either clicking on the pages listed below, or by using the keyword search tool below to find specific information within the annual report.-
 1
1 -
2
-
3
-
4
-
5
-
6
-
7
-
8
-
9
-
10
-
11
-
12
-
13
-
14
-
15
-
16
-
17
-
18
-
19
-
20
-
21
-
22
-
23
-
24
-
25
-
26
-
27
-
28
-
29
-
30
-
31
-
32
-
33
-
34
-
35
-
36
-
37
-
38
-
39
-
40
-
41
-
42
-
43
-
44
-
45
-
46
-
47
-
48
-
 49
49 -
 50
50 -
 51
51 -
 52
52 -
 53
53 -
 54
54 -
 55
55 -
 56
56 -
 57
57 -
 58
58 -
 59
59 -
 60
60 -
 61
61 -
 62
62 -
 63
63 -
 64
64 -
 65
65 -
 66
66 -
 67
67 -
 68
68 -
 69
69 -
70
-
71
-
72
-
73
-
74
-
75
-
76
-
77
-
78
-
79
-
80
-
81
-
82
-
83
-
84
-
85
-
86
-
87
-
88
-
89
-
90
-
91
-
92
-
93
-
94
-
95
-
96
-
97
-
98
-
99
-
100
-
101
-
102
-
103
-
104
-
105
-
106
-
107
-
108
-
109
-
110
-
111
-
112
-
113
-
114
-
115
-
116
-
117
-
118
-
119
-
120
-
121
-
122
-
123
-
124
-
125
-
126
-
127
 |
 |
TOYOTA ANNUAL REPORT 2012
Toyota Global Vision Changes for Making
Ever-Better Cars President
ʼ
s Message Medium- to Long-Term
Growth Initiatives Special Feature Management and
Corporate Information Investor Information
Business and
Performance Review Financial Section
Management's Discussion and Analysis of Financial Condition and Results of Operations
Interest and dividend income increased by ¥9.0
billion, or 10.0%, to ¥99.8 billion during fiscal 2012
compared with the prior fiscal year.
Interest expense decreased by ¥6.3 billion,
or 21.8%, to ¥22.9 billion during fiscal 2012
compared with the prior fiscal year.
Foreign exchange gain, net increased by ¥22.8
billion, or 159.4%, to ¥37.1 billion during fiscal
2012 compared with the prior fiscal year. Foreign
exchange gains and losses include the differences
between the value of foreign currency denominated
sales translated at prevailing exchange rates and
the value of the sales amounts settled during the
fiscal year, including those settled using forward
foreign currency exchange contracts.
Other loss, net decreased by ¥56.0 billion to
¥36.8 billion during fiscal 2012 compared with the
prior fiscal year. This was due to the recognition of
impairment losses on available-for-sale securities.
The provision for income taxes decreased by ¥50.5
billion, or 16.2%, to ¥262.2 billion during fiscal
2012 compared with the prior fiscal year due to
the decrease in income before income taxes.
The effective tax rate for fiscal 2012 was 60.6%,
which was higher than the statutory tax rate in
Japan. This was due to recurring items such as
the valuation allowance and deferred tax liabilities
relating to undistributed earnings in affiliated
companies accounted for by the equity method.
The automotive operations segment is Toyota
ʼ
s
largest operating segment by net revenues. Net
revenues for the automotive segment decreased
during fiscal 2012 by ¥342.7 billion, or 2.0%,
compared with the prior fiscal year to ¥16,994.5
billion. The decrease reflects the ¥649.2 billion
unfavorable impact of fluctuations in foreign
currency translation rates and others, partially
offset by the ¥320.0 billion of favorable impact by
changes in vehicle unit sales and sales mix, and
other operational factors.
Operating income from the automotive
operations decreased by ¥64.3 billion during
with losses of ¥26.1 billion in the prior fiscal
year. The increase in unrealized holding gains on
securities was due to changes in stock prices.
Net income attributable to noncontrolling interests
increased by ¥27.4 billion, or 47.9%, to ¥84.7
billion during fiscal 2012 compared with the prior
fiscal year. This increase was due to an increase
during fiscal 2012 in net income attributable to the
shareholders of consolidated subsidiaries.
Equity in earnings of affiliated companies
during fiscal 2012 decreased by ¥17.3 billion, or
8.1%, to ¥197.7 billion compared with the prior
fiscal year. This decrease was due to a decrease
during fiscal 2012 in net income attributable to the
shareholders of affiliated companies accounted
for by the equity method.
Net income attributable to the shareholders of
Toyota Motor Corporation decreased by ¥124.6
billion, or 30.5%, to ¥283.5 billion during fiscal
2012 compared with the prior fiscal year.
Other comprehensive loss decreased by ¥263.8
billion to ¥34.1 billion for fiscal 2012 compared
with the prior fiscal year. This decrease resulted
from unfavorable foreign currency translation
adjustments losses of ¥87.7 billion in fiscal 2012
compared with losses of ¥287.6 billion in the prior
fiscal year, and from unrealized holding gains on
securities in fiscal 2012 of ¥129.3 billion compared
■
Other Income and Expenses
Automotive Operations Segment
■
Income Taxes
■
Other Comprehensive Income and Loss
■
Net Income attributable to Toyota Motor
Corporation
■
Net Income and Loss attributable to
Noncontrolling Interests and Equity in
Earnings of Affiliated Companies
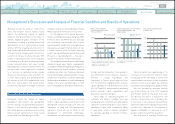
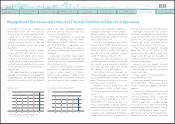
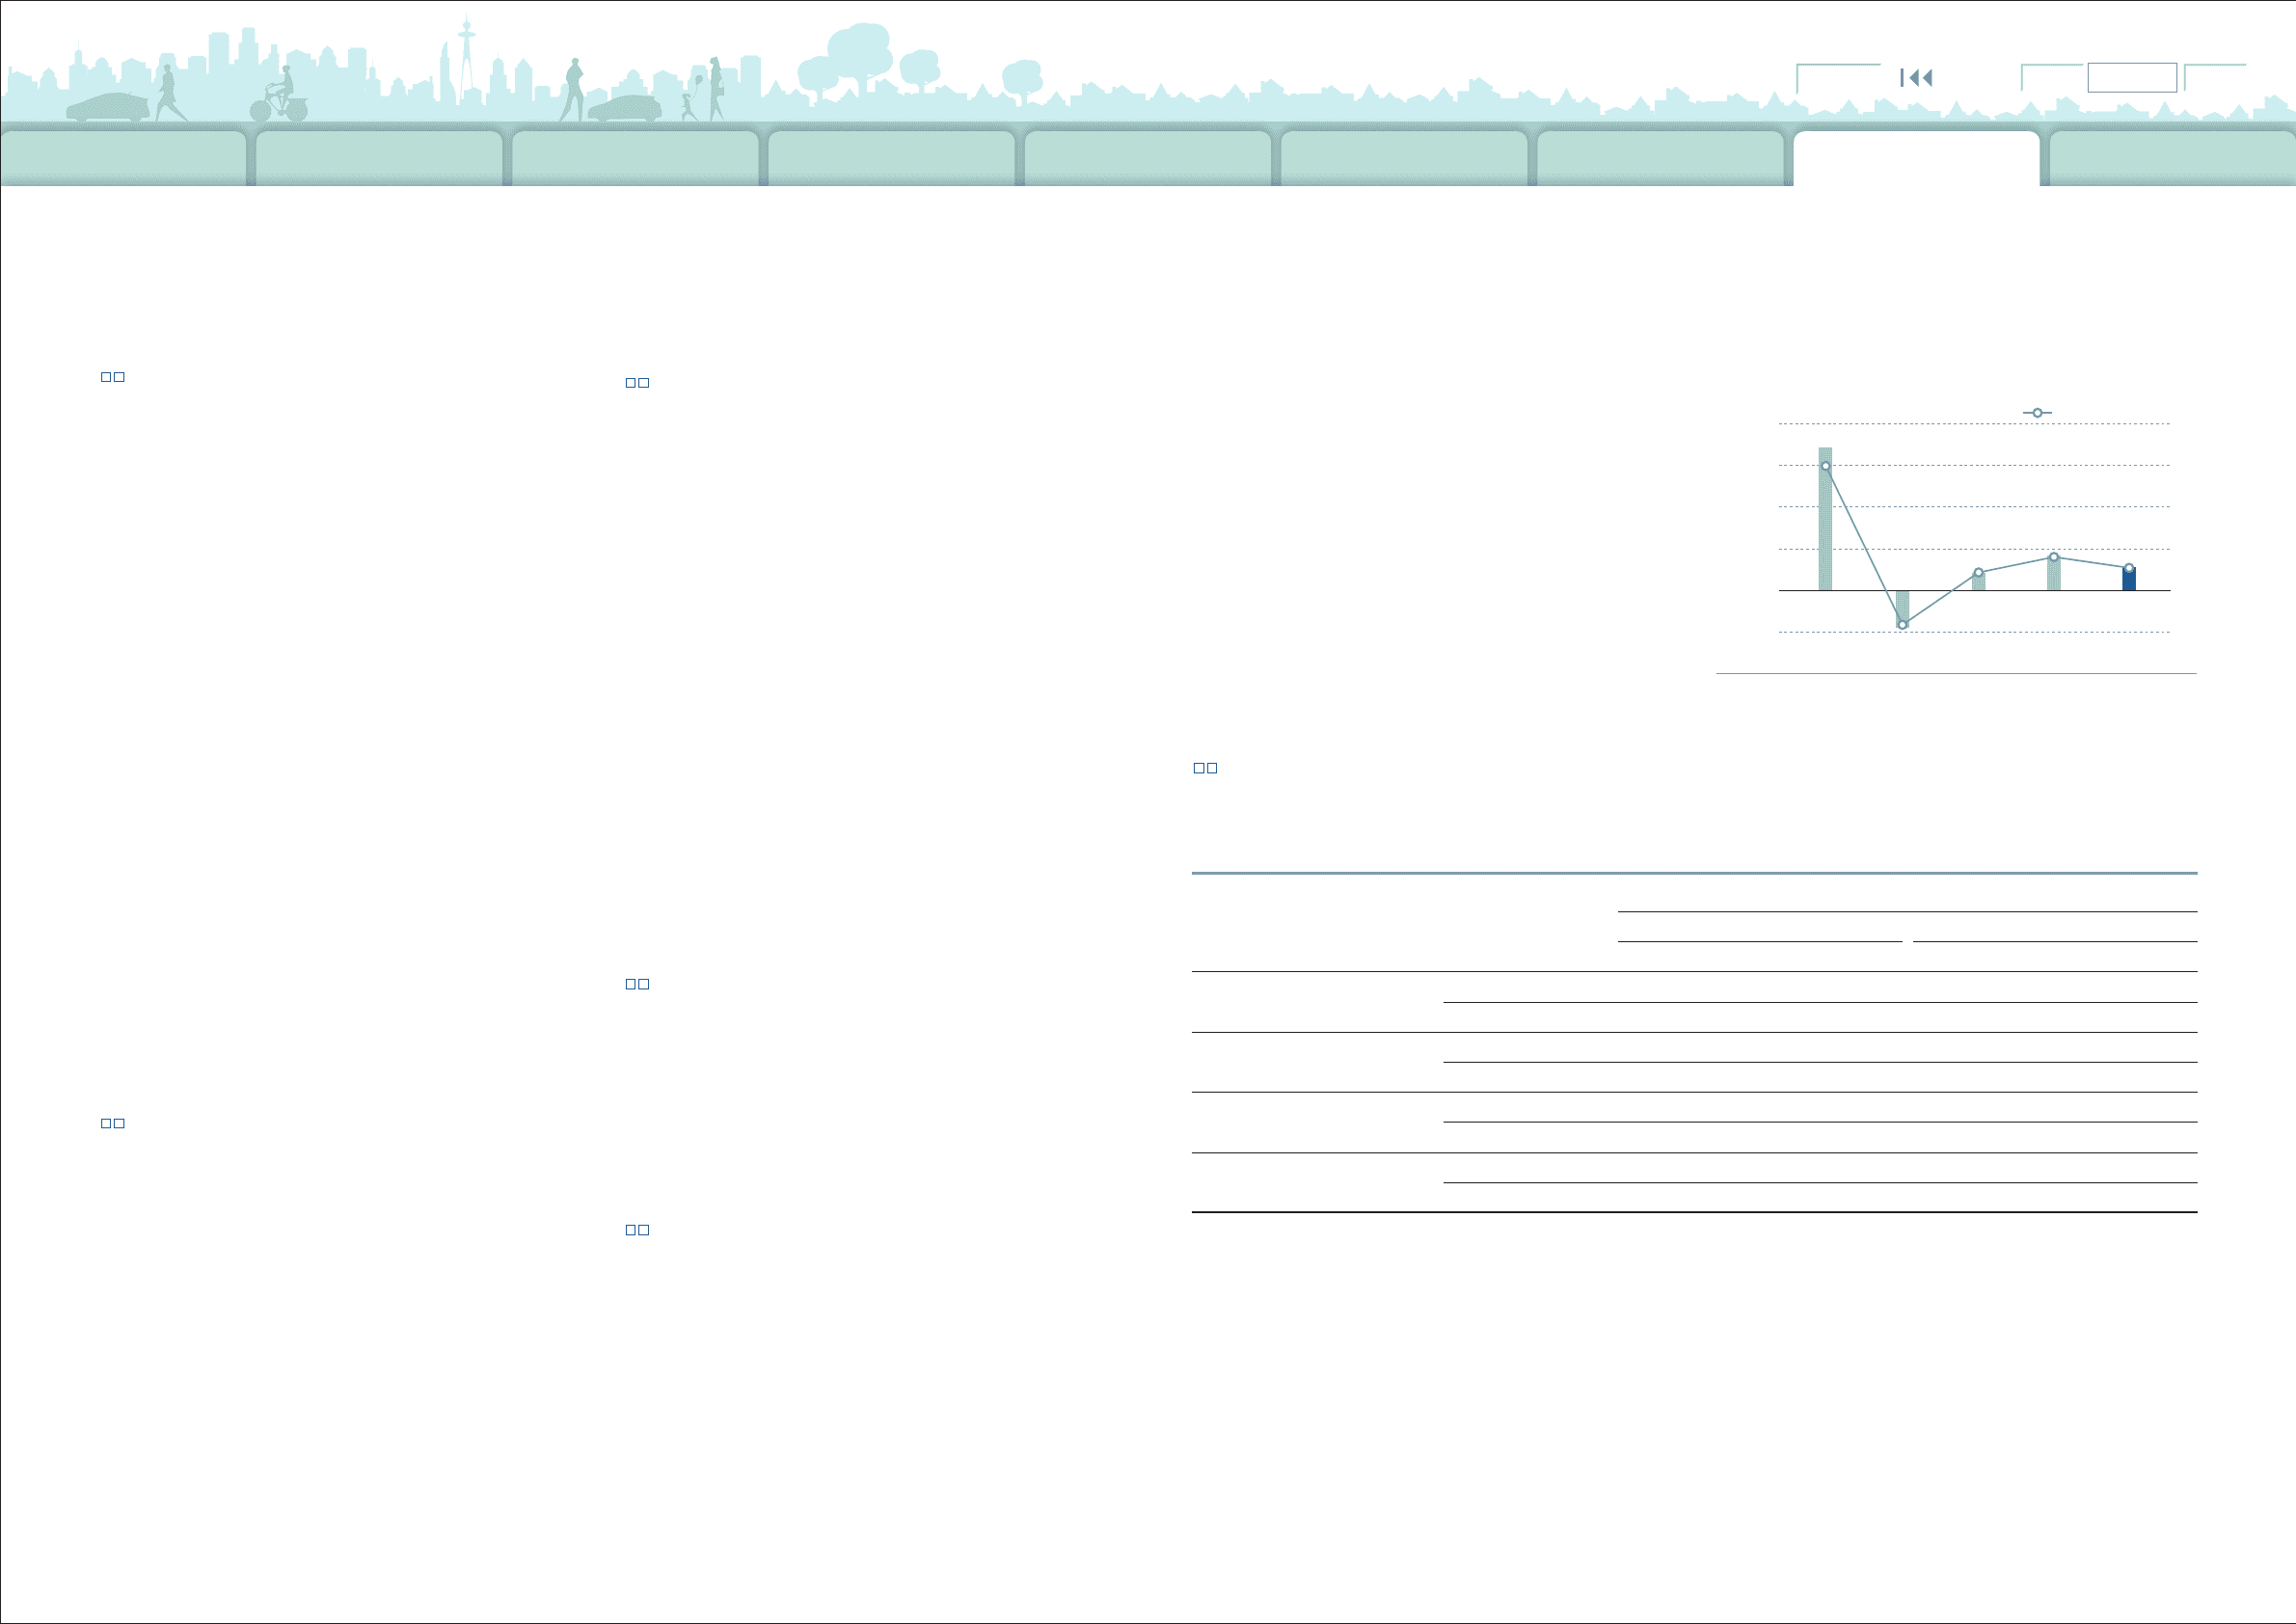
(¥ Billion) (%)
ROE (Right scale)
‘12‘09 ‘10
‘08
‘11
0
500
-500
1,000
1,500
2,000 20
15
10
5
0
-5
Net Income
(
Loss
)
and ROE
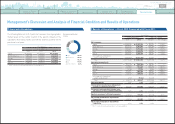
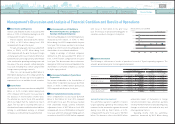
The following is a discussion of results of operations for each of Toyota
ʼ
s operating segments. The
amounts presented are prior to intersegment elimination.
■
Segment Information
Yen in millions
Year ended March 31, 2012 vs. 2011 Change
2011 2012 Amount Percentage
Automotive: Net revenues ¥17,337,320 ¥16,994,546 ¥
(
342,774
)
-
2.0%
Operating income 85,973 21,683
(
64,290
)
-
74.8%
Financial Services: Net revenues ¥ 1,192,205 ¥ 1,100,324 ¥
(
91,881
)
-
7.7%
Operating income 358,280 306,438
(
51,842
)
-
14.5%
All Other: Net revenues ¥ 972,252 ¥ 1,048,915 ¥ 76,663 +7.9%
Operating income 35,242 42,062 6,820 +19.4%
Intersegment elimination/
unallocated amount:
Net revenues ¥
(
508,089
)
¥
(
560,132
)
¥
(
52,043
)—
Operating income
(
11,216
)(
14,556
)(
3,340
)—
0820
Search NextPrev page 59
Contents