Toyota 2012 Annual Report Download - page 117
Download and view the complete annual report
Please find page 117 of the 2012 Toyota annual report below. You can navigate through the pages in the report by either clicking on the pages listed below, or by using the keyword search tool below to find specific information within the annual report.-
 1
1 -
2
-
3
-
4
-
5
-
6
-
7
-
8
-
9
-
10
-
11
-
12
-
13
-
14
-
15
-
16
-
17
-
18
-
19
-
20
-
21
-
22
-
23
-
24
-
25
-
26
-
27
-
28
-
29
-
30
-
31
-
32
-
33
-
34
-
35
-
36
-
37
-
38
-
39
-
40
-
41
-
42
-
43
-
44
-
45
-
46
-
47
-
48
-
49
-
50
-
51
-
52
-
53
-
54
-
55
-
56
-
57
-
58
-
59
-
60
-
61
-
62
-
63
-
64
-
65
-
66
-
67
-
68
-
69
-
70
-
71
-
72
-
73
-
74
-
75
-
76
-
77
-
78
-
79
-
80
-
81
-
82
-
83
-
84
-
85
-
86
-
87
-
88
-
89
-
90
-
91
-
92
-
93
-
94
-
95
-
96
-
97
-
98
-
99
-
100
-
101
-
102
-
103
-
104
-
105
-
106
-
 107
107 -
 108
108 -
 109
109 -
 110
110 -
 111
111 -
 112
112 -
 113
113 -
 114
114 -
 115
115 -
 116
116 -
 117
117 -
 118
118 -
 119
119 -
 120
120 -
 121
121 -
 122
122 -
 123
123 -
 124
124 -
 125
125 -
 126
126 -
 127
127
 |
 |
TOYOTA ANNUAL REPORT 2012
Toyota Global Vision Changes for Making
Ever-Better Cars President
ʼ
s Message Medium- to Long-Term
Growth Initiatives Special Feature Management and
Corporate Information Investor Information
Business and
Performance Review Financial Section
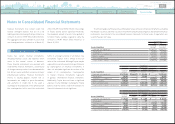
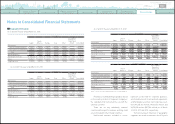
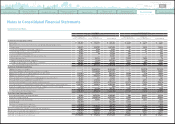
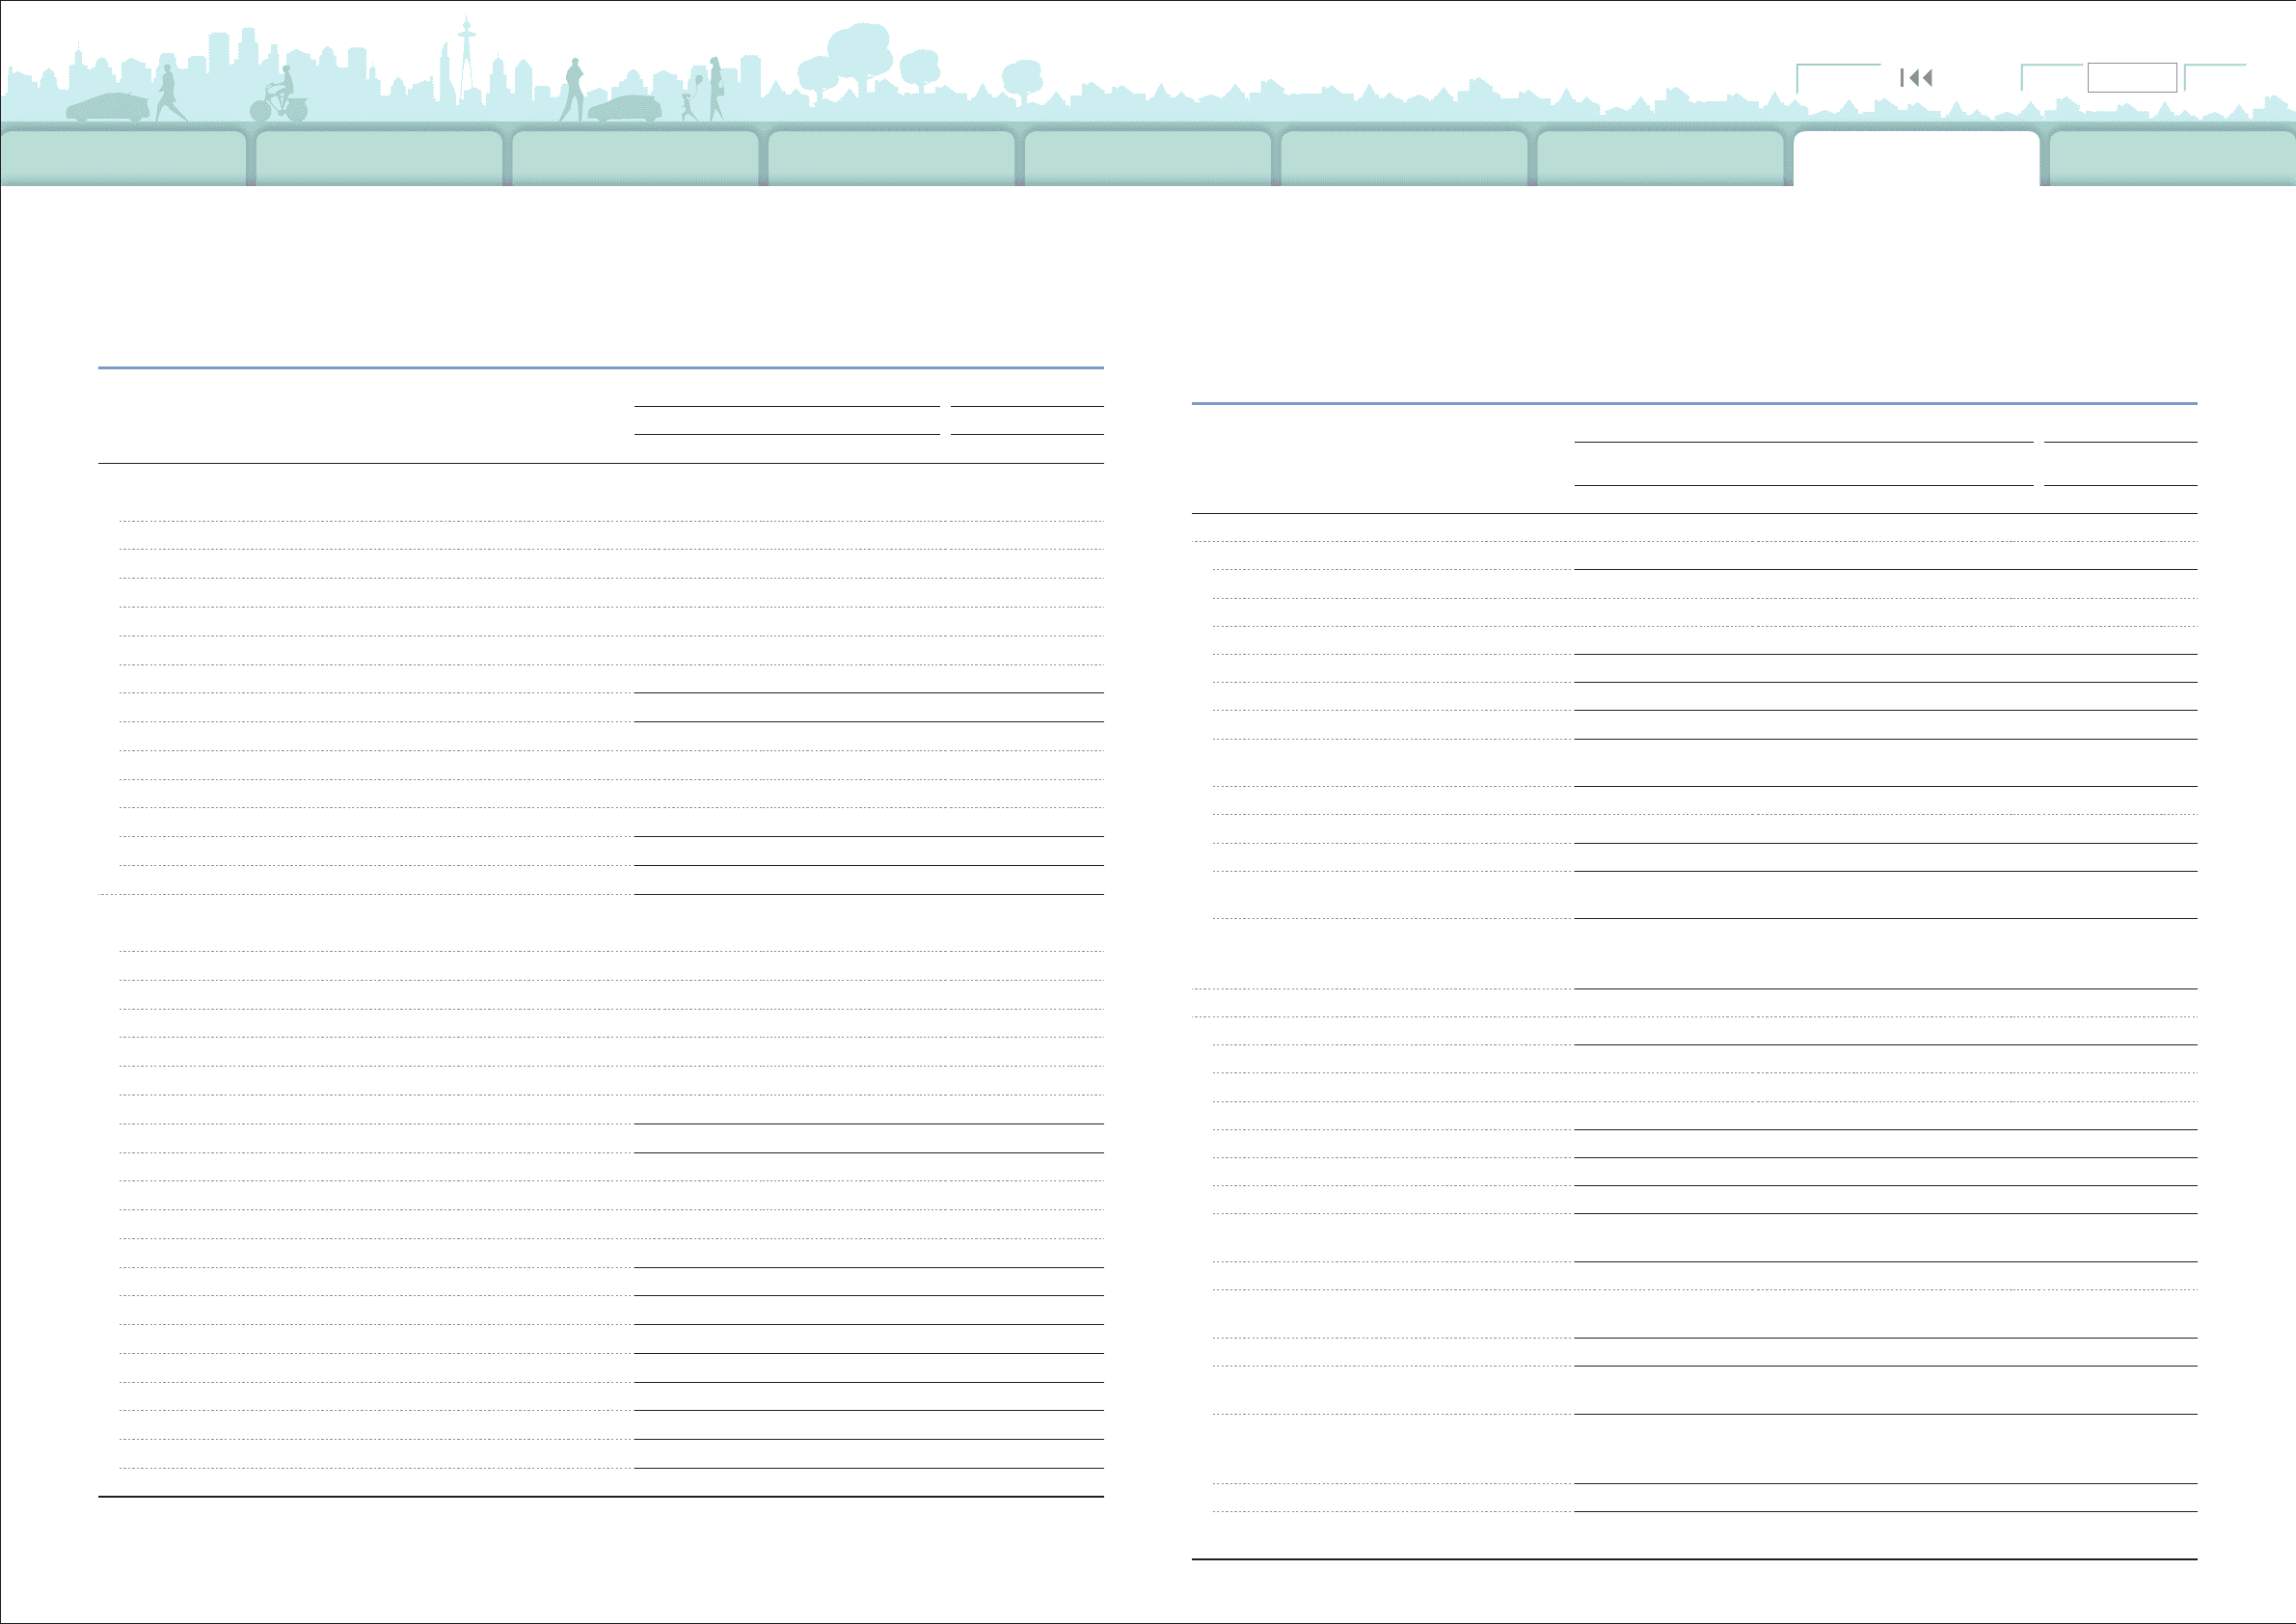
Notes to Consolidated Financial Statements
Yen in millions
U.S. dollars in millions
March 31, March 31,
2011 2012 2012
Non-Financial Services Businesses
Current liabilities
Short-term borrowings ¥ 478,646 ¥ 715,019 $ 8,699
Current portion of long-term debt 243,817 339,441 4,130
Accounts payable 1,497,253 2,234,316 27,185
Accrued expenses 1,666,748 1,737,490 21,140
Income taxes payable 104,392 123,344 1,501
Other current liabilities 1,024,662 1,175,801 14,306
Total current liabilities 5,015,518 6,325,411 76,961
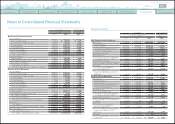
Long-term liabilities
Long-term debt 839,611 503,070 6,121
Accrued pension and severance costs 660,918 700,211 8,519
Other long-term liabilities 554,402 531,982 6,473
Total long-term liabilities 2,054,931 1,735,263 21,113
Total Non-Financial Services Businesses liabilities 7,070,449 8,060,674 98,074
Financial Services Businesses
Current liabilities
Short-term borrowings 2,986,700 3,040,373 36,992
Current portion of long-term debt 2,541,479 2,218,526 26,992
Accounts payable 19,472 27,095 330
Accrued expenses 110,348 96,247 1,171
Income taxes payable 9,555 10,434 127
Other current liabilities 538,026 536,291 6,525
Total current liabilities 6,205,580 5,928,966 72,137
Long-term liabilities
Long-term debt 5,669,456 5,555,112 67,588
Accrued pension and severance costs 7,104 8,191 100
Other long-term liabilities 435,508 520,252 6,330
Total long-term liabilities 6,112,068 6,083,555 74,018
Total Financial Services Businesses liabilities 12,317,648 12,012,521 146,155
Eliminations
(
489,955
)(
488,708
) (
5,946
)
Total liabilities 18,898,142 19,584,487 238,283
Total Toyota Motor Corporation shareholders
ʼ
equity 10,332,371 10,550,261 128,364
Noncontrolling interests 587,653 516,217 6,281
Total shareholders
ʼ
equity 10,920,024 11,066,478 134,645
Total liabilities and shareholders
ʼ
equity ¥ 29,818,166 ¥ 30,650,965 $ 372,928
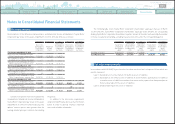
Yen in millions
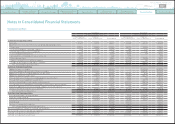
U.S. dollars in millions
For the years ended March 31, For the year ended
March 31,
2010 2011 2012 2012
Non-Financial Services Businesses
Net revenues ¥ 17,732,143 ¥ 17,826,986 ¥ 17,534,872 $ 213,345
Costs and expenses
Cost of revenues 15,973,442 15,986,741 15,796,635 192,196
Selling, general and administrative 1,854,710 1,723,071 1,676,999 20,404
Total costs and expenses 17,828,152 17,709,812 17,473,634 212,600
Operating income
(
loss
) (
96,009
)
117,174 61,238 745
Other income, net 144,625 88,840 69,935 851
Income before income taxes and equity
in earnings of affiliated companies 48,616 206,014 131,173 1,596
Provision for income taxes 42,342 178,795 141,558 1,722
Equity in earnings of affiliated companies
109,944 214,229 196,544 2,391
Net income 116,218 241,448 186,159 2,265
Less: Net income attributable to
noncontrolling interests
(
32,103
) (
54,055
)(
82,181
) (
1,000
)
Net income attributable to Toyota Motor
Corporation- Non-Financial Services
Businesses 84,115 187,393 103,978 1,265
Financial Services Businesses
Net revenues 1,245,407 1,192,205 1,100,324 13,388
Costs and expenses
Cost of revenues 716,997 636,374 615,563 7,490
Selling, general and administrative 281,483 197,551 178,323 2,170
Total costs and expenses 998,480 833,925 793,886 9,660
Operating income 246,927 358,280 306,438 3,728
Other income
(
expense
)
, net
(
3,923
)
1,349
(
4,679
) (
57
)
Income before income taxes and equity
in earnings of affiliated companies 243,004 359,629 301,759 3,671
Provision for income taxes 50,362 134,094 120,725 1,468
Equity in earnings
(
losses
)
of affiliated
companies
(
64,536
)
787 1,157 14
Net income 128,106 226,322 182,191 2,217
Less: Net income attributable to
noncontrolling interests
(
2,653
) (
3,251
)(
2,566
) (
32
)
Net income attributable to Toyota Motor
Corporation - Financial Services
Businesses 125,453 223,071 179,625 2,185
Eliminations
(
112
) (
2,281
)(
44
) (
0
)
Net income attributable to Toyota Motor
Corporation ¥ 209,456 ¥ 408,183 ¥ 283,559 $ 3,450
Statements of income
0820
Search NextPrev page 117
Contents