Toyota 2012 Annual Report Download - page 55
Download and view the complete annual report
Please find page 55 of the 2012 Toyota annual report below. You can navigate through the pages in the report by either clicking on the pages listed below, or by using the keyword search tool below to find specific information within the annual report.-
 1
1 -
2
-
3
-
4
-
5
-
6
-
7
-
8
-
9
-
10
-
11
-
12
-
13
-
14
-
15
-
16
-
17
-
18
-
19
-
20
-
21
-
22
-
23
-
24
-
25
-
26
-
27
-
28
-
29
-
30
-
31
-
32
-
33
-
34
-
35
-
36
-
37
-
38
-
39
-
40
-
41
-
42
-
43
-
44
-
 45
45 -
 46
46 -
 47
47 -
 48
48 -
 49
49 -
 50
50 -
 51
51 -
 52
52 -
 53
53 -
 54
54 -
 55
55 -
 56
56 -
 57
57 -
 58
58 -
 59
59 -
 60
60 -
 61
61 -
 62
62 -
 63
63 -
 64
64 -
 65
65 -
66
-
67
-
68
-
69
-
70
-
71
-
72
-
73
-
74
-
75
-
76
-
77
-
78
-
79
-
80
-
81
-
82
-
83
-
84
-
85
-
86
-
87
-
88
-
89
-
90
-
91
-
92
-
93
-
94
-
95
-
96
-
97
-
98
-
99
-
100
-
101
-
102
-
103
-
104
-
105
-
106
-
107
-
108
-
109
-
110
-
111
-
112
-
113
-
114
-
115
-
116
-
117
-
118
-
119
-
120
-
121
-
122
-
123
-
124
-
125
-
126
-
127
 |
 |

TOYOTA ANNUAL REPORT 2012
Toyota Global Vision Changes for Making
Ever-Better Cars President
ʼ
s Message Medium- to Long-Term
Growth Initiatives Special Feature Management and
Corporate Information Investor Information
Business and
Performance Review Financial Section
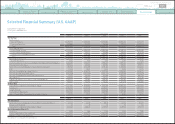
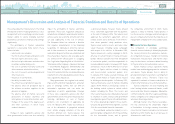
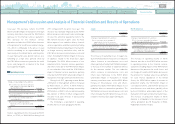
Management's Discussion and Analysis of Financial Condition and Results of Operations
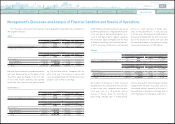
The following is a discussion of net revenues in each geographic market
(
before the elimination of
intersegment revenues
)
.
by 130 thousand vehicles compared with the
prior fiscal year. The increase in vehicle unit
sales resulted primarily from introduction of new
products such as Prius
α
and Aqua.
vehicles, or 22.4%, decrease in Tundra sales,
and a 21 thousand vehicles, or 7.3%, decrease
in Corolla sales. Net revenues in North America
decreased compared with the prior fiscal year
due to the decrease in vehicle unit sales and
the unfavorable impact of fluctuations in foreign
currency translation rates of ¥398.9 billion.
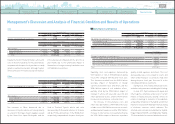
vehicles decreased in some European countries
compared with the prior fiscal year, such as a
18 thousand vehicles decrease in Italy and a 7
thousand vehicles decrease in Portugal, both of
which mainly due to the European credit crisis.
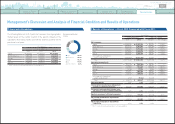
Although Toyota
ʼ
s domestic and exported vehicle
unit sales decreased due to the impact of the
Great East Japan Earthquake in the first half
of fiscal 2012, Toyota
ʼ
s domestic and exported
vehicle unit sales over the fiscal year increased
In North America, the vehicle unit sales decreased
by 159 thousand vehicles compared with the prior
fiscal year due to decreased production as a
result of shortages of parts supplies caused by
the Great East Japan Earthquake and the flood
in Thailand, consisting of a 67 thousand vehicles,
or 30.7%, decrease in RAV4 sales, a 26 thousand
Net revenues in Europe as a whole increased
due primarily to the 2 thousand vehicles increase
in vehicle unit sales compared with the prior
fiscal year, such as a 49 thousand vehicles
increase in Russia, where the economy has
been strong, although sales of Toyota brands
ʼ
North America
Thousands of units
Year ended March 31, 2012 vs. 2011 Change
2011 2012 Amount Percentage
Toyota
ʼ
s consolidated vehicle unit sales 2,031 1,872
(
159
)
-
7.8%
Yen in millions
Year ended March 31, 2012 vs. 2011 Change
2011 2012 Amount Percentage
Net revenues:
Sales of products ¥4,603,192 ¥ 4,048,532 ¥
(
554,660
)
-
12.0%
Financial services 825,944 703,354
(
122,590
)
-
14.8%
Total ¥5,429,136 ¥ 4,751,886 ¥
(
677,250
)
-
12.5%
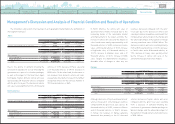
Japan
Thousands of units
Year ended March 31, 2012 vs. 2011 Change
2011 2012 Amount Percentage
Toyota
ʼ
s consolidated vehicle unit sales* 3,611 3,741 130 +3.6%
* including number of exported vehicle unit sales
Yen in millions
Year ended March 31, 2012 vs. 2011 Change
2011 2012 Amount Percentage
Net revenues:
Sales of products ¥ 10,864,329 ¥ 11,040,964 ¥176,635 +1.6%
Financial services 121,917 126,355 4,438 +3.6%
Total ¥ 10,986,246 ¥ 11,167,319 ¥181,073 +1.6%
Europe
Thousands of units
Year ended March 31, 2012 vs. 2011 Change
2011 2012 Amount Percentage
Toyota
ʼ
s consolidated vehicle unit sales 796 798 2+0.3%
Yen in millions
Year ended March 31, 2012 vs. 2011 Change
2011 2012 Amount Percentage
Net revenues:
Sales of products ¥1,910,336 ¥ 1,925,670 ¥15,334 +0.8%
Financial services 71,161 68,276
(
2,885
)
-
4.1%
Total ¥1,981,497 ¥ 1,993,946 ¥12,449 +0.6%
0820
Search NextPrev page 55
Contents