Toyota 2012 Annual Report Download - page 45
Download and view the complete annual report
Please find page 45 of the 2012 Toyota annual report below. You can navigate through the pages in the report by either clicking on the pages listed below, or by using the keyword search tool below to find specific information within the annual report.-
 1
1 -
2
-
3
-
4
-
5
-
6
-
7
-
8
-
9
-
10
-
11
-
12
-
13
-
14
-
15
-
16
-
17
-
18
-
19
-
20
-
21
-
22
-
23
-
24
-
25
-
26
-
27
-
28
-
29
-
30
-
31
-
32
-
33
-
34
-
 35
35 -
 36
36 -
 37
37 -
 38
38 -
 39
39 -
 40
40 -
 41
41 -
 42
42 -
 43
43 -
 44
44 -
 45
45 -
 46
46 -
 47
47 -
 48
48 -
 49
49 -
 50
50 -
 51
51 -
 52
52 -
 53
53 -
 54
54 -
 55
55 -
56
-
57
-
58
-
59
-
60
-
61
-
62
-
63
-
64
-
65
-
66
-
67
-
68
-
69
-
70
-
71
-
72
-
73
-
74
-
75
-
76
-
77
-
78
-
79
-
80
-
81
-
82
-
83
-
84
-
85
-
86
-
87
-
88
-
89
-
90
-
91
-
92
-
93
-
94
-
95
-
96
-
97
-
98
-
99
-
100
-
101
-
102
-
103
-
104
-
105
-
106
-
107
-
108
-
109
-
110
-
111
-
112
-
113
-
114
-
115
-
116
-
117
-
118
-
119
-
120
-
121
-
122
-
123
-
124
-
125
-
126
-
127
 |
 |
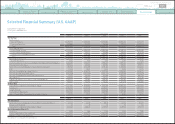
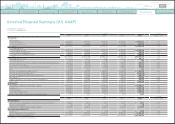
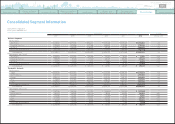
TOYOTA ANNUAL REPORT 2012
Toyota Global Vision Changes for Making
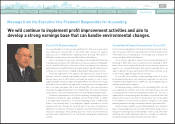
Ever-Better Cars President
ʼ
s Message Medium- to Long-Term
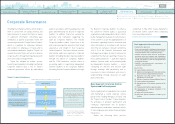
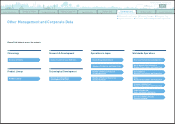
Growth Initiatives Special Feature Management and
Corporate Information Investor Information
Business and
Performance Review Financial Section
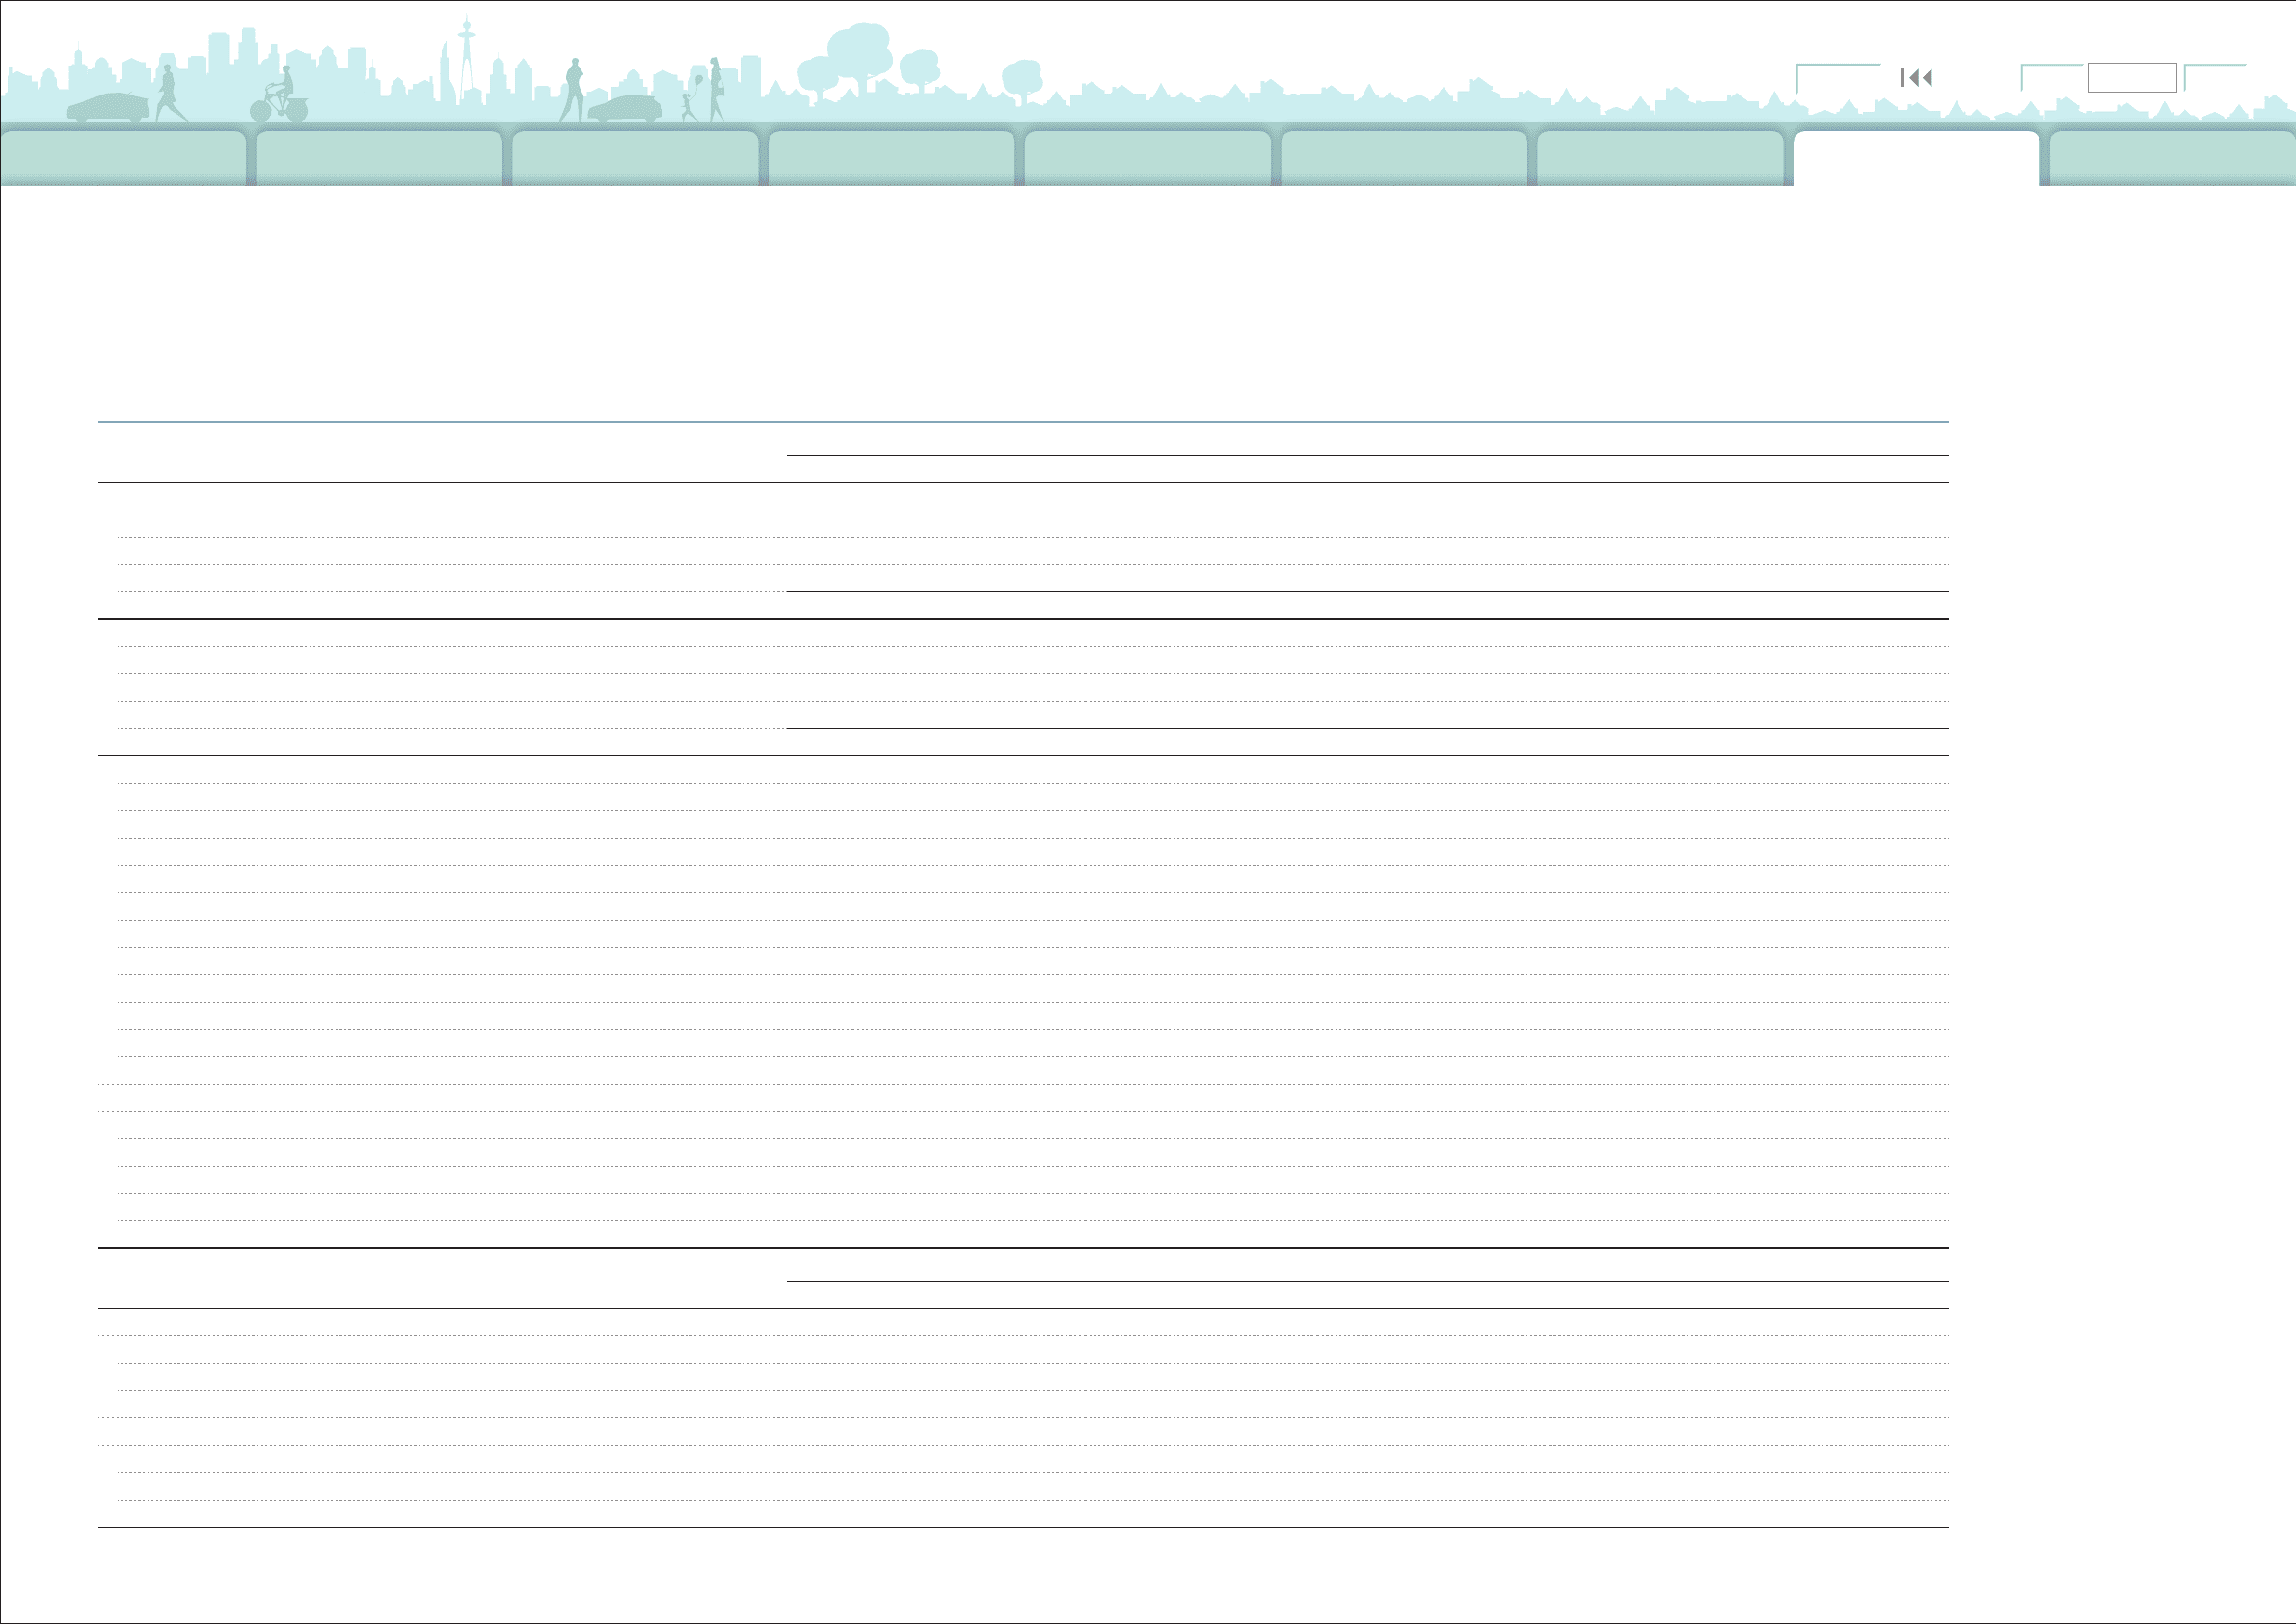
Yen in millions
2003 2004 2005 2006 2007
For the Year:
Net Revenues:
Sales of Products ¥14,793,973 ¥16,578,033 ¥17,790,862 ¥20,059,493 ¥22,670,097
Financing Operations 707,580 716,727 760,664 977,416 1,277,994
Total ¥15,501,553 ¥17,294,760 ¥18,551,526 ¥21,036,909 ¥23,948,091
Costs and Expenses:
Cost of Products Sold ¥11,914,245 ¥13,506,337 ¥14,500,282 ¥16,335,312 ¥18,356,255
Cost of Financing Operations 423,885 364,177 369,844 609,632 872,138
Selling, General and Administrative 1,891,777 1,757,356 2,009,213 2,213,623 2,481,015
Total ¥14,229,907 ¥15,627,870 ¥16,879,339 ¥19,158,567 ¥21,709,408
Operating Income
(
Loss
)
¥ 1,271,646 ¥ 1,666,890 ¥ 1,672,187 ¥ 1,878,342 ¥ 2,238,683
% of Net Revenues 8.2% 9.6% 9.0% 8.9% 9.3%
Income
(
Loss
)
before Income Taxes and Equity in Earnings of Affiliated Companies
1,226,652 1,765,793 1,754,637 2,087,360 2,382,516
Provision for Income Taxes 517,014 681,304 657,910 795,153 898,312
Net Income
(
Loss
)
attributable to Toyota Motor Corporation 750,942 1,162,098 1,171,260 1,372,180 1,644,032
ROE 10.4% 15.2% 13.6% 14.0% 14.7%
Net Cash Provided by Operating Activities ¥ 1,940,088 ¥ 2,186,734 ¥ 2,370,940 ¥ 2,515,480 ¥ 3,238,173
Net Cash Used in Investing Activities
(
2,001,448
) (
2,216,495
) (
3,061,196
) (
3,375,500
) (
3,814,378
)
Net Cash Provided by
(
Used in
)
Financing Activities 37,675 242,223 419,384 876,911 881,768
R&D Expenses 668,404 682,279 755,147 812,648 890,782
Capital Expenditures for Property, Plant and Equipment* 1,005,931 945,803 1,068,287 1,523,459 1,425,814
Depreciation 870,636 969,904 997,713 1,211,178 1,382,594
At Year-End:
Toyota Motor Corporation Shareholders
ʼ
Equity ¥ 7,121,000 ¥ 8,178,567 ¥ 9,044,950 ¥10,560,449 ¥11,836,092
Total Assets 20,152,974 22,040,228 24,335,011 28,731,595 32,574,779
Long-Term Debt 4,137,528 4,247,266 5,014,925 5,640,490 6,263,585
Cash and Cash Equivalents 1,592,028 1,729,776 1,483,753 1,569,387 1,900,379
Ratio of Toyota Motor Corporation Shareholders
ʼ
Equity 35.3% 37.1% 37.2% 36.8% 36.3%
Yen
2003 2004 2005 2006 2007
Per Share Data:
Net Income
(
Loss
)
attributable to Toyota Motor Corporation
(
Basic
)
¥ 211.32 ¥ 342.90 ¥ 355.35 ¥ 421.76 ¥ 512.09
Annual Cash Dividends 36 45 65 90 120
Toyota Motor Corporation Shareholders
ʼ
Equity 2,063.43 2,456.08 2,767.67 3,257.63 3,701.17
Stock Information
(
March 31
)
:
Stock Price ¥ 2,635 ¥ 3,880 ¥ 3,990 ¥ 6,430 ¥ 7,550
Market Capitalization
(
Yen in millions
)
¥ 9,512,343 ¥14,006,790 ¥14,403,890 ¥23,212,284 ¥27,255,481
Number of Shares Issued
(
shares
)
3,609,997,492 3,609,997,492 3,609,997,492 3,609,997,492 3,609,997,492
Toyota Motor Corporation
Fiscal years ended March 31
* Excluding vehicles and equipment of operating leases
Selected Financial Summary
(
U.S. GAAP
)
0820
Search NextPrevContents page 45