Toyota 2012 Annual Report Download - page 24
Download and view the complete annual report
Please find page 24 of the 2012 Toyota annual report below. You can navigate through the pages in the report by either clicking on the pages listed below, or by using the keyword search tool below to find specific information within the annual report.-
 1
1 -
2
-
3
-
4
-
5
-
6
-
7
-
8
-
9
-
10
-
11
-
12
-
13
-
 14
14 -
 15
15 -
 16
16 -
 17
17 -
 18
18 -
 19
19 -
 20
20 -
 21
21 -
 22
22 -
 23
23 -
 24
24 -
 25
25 -
 26
26 -
 27
27 -
 28
28 -
 29
29 -
 30
30 -
 31
31 -
 32
32 -
 33
33 -
 34
34 -
35
-
36
-
37
-
38
-
39
-
40
-
41
-
42
-
43
-
44
-
45
-
46
-
47
-
48
-
49
-
50
-
51
-
52
-
53
-
54
-
55
-
56
-
57
-
58
-
59
-
60
-
61
-
62
-
63
-
64
-
65
-
66
-
67
-
68
-
69
-
70
-
71
-
72
-
73
-
74
-
75
-
76
-
77
-
78
-
79
-
80
-
81
-
82
-
83
-
84
-
85
-
86
-
87
-
88
-
89
-
90
-
91
-
92
-
93
-
94
-
95
-
96
-
97
-
98
-
99
-
100
-
101
-
102
-
103
-
104
-
105
-
106
-
107
-
108
-
109
-
110
-
111
-
112
-
113
-
114
-
115
-
116
-
117
-
118
-
119
-
120
-
121
-
122
-
123
-
124
-
125
-
126
-
127
 |
 |
Toyota Global Vision Changes for Making
Ever-Better Cars President
ʼ
s Message Medium- to Long-Term
Growth Initiatives Special Feature Management and
Corporate Information Financial Section Investor Information
Business and
Performance Review
TOYOTA ANNUAL REPORT 2012
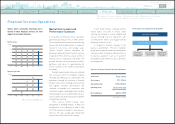
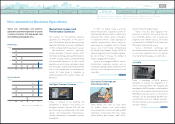
Automotive Operations
with supply shortages caused by the Great East
Japan Earthquake in the first half having a major
impact. 2011 market share in the United States
was 12.9%. Sales of the Lexus brand in North
America were at approximately 214 thousand
units. Consolidated vehicle production was
1,275 thousand units, a 63 thousand-unit or
4.8% decrease year-on-year.
As a result, net revenues were ¥4,751.8
billion, a decrease of ¥677.2 billion or 12.5%
year-on-year. Due to decreases in production
and units sold, as well as the impact of gains
or losses on doubtful accounts of our dealer
finance subsidiary in the United States,
operating income was down ¥153.0 billion, or
45.1% year-on-year.
Consolidated vehicle sales in Europe in fiscal
2012 rose 2 thousand units, or 0.3% year-on-
year, to 798 thousand units. Toyota
ʼ
s European
market share
(
2011; about 40 countries
)
was
4.2%. Lexus sales totaled approximately 47
thousand units. Consolidated vehicle production
increased 11 thousand units, or 3.2% year-on-
year, to 383 thousand units.
As a result, net revenues increased ¥12.4
billion, or 0.6% year-on-year, to ¥1,993.9 billion.
Operating income was ¥17.7 billion, an increase
of ¥4.6 billion, or 35.4% year-on-year.
year-on-year, to ¥21.6 billion.
Performance by geographic segment was
as follows.
In fiscal 2012, due to active new product
campaigns and the efforts of dealers nationwide,
consolidated vehicle sales in Japan increased by
158 thousand units, or 8.2%, to 2,071 thousand
units. Market share for Toyota and Lexus brands,
excluding mini-vehicles, was 45.5%, while the
share including mini-vehicles
(
including Daihatsu
and Hino
)
was 43.2%, indicating a strong market
share continuing from the previous fiscal year.
Sales of the Lexus brand were approximately 45
thousand units. Consolidated vehicle production
was up 219 thousand units, or 5.9% year-on-year,
to 3,940 thousand units.
As a result, net revenues were ¥11,167.3
billion, an increase of ¥181.0 billion or 1.6%
year-on-year. The operating loss of ¥207.0 billion
represents a ¥155.3 billion improvement over
the previous fiscal year. Despite the impact of
currency exchange fluctuations, cost-reduction
efforts and increases in production and units
sold resulted in the decrease in operating losses.
Consolidated vehicle sales in North America in
fiscal 2012 decreased by 159 thousand units,
or 7.8% year-on-year, to 1,872 thousand units,
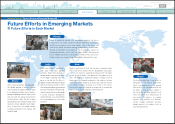
Despite bullish automotive markets in the U.S.
and emerging markets in Asia and elsewhere
during the fiscal year under review, the majority
of Japanese automakers, including Toyota,
suffered the twin impact of the Great East Japan
Earthquake and the Thailand floods. These
events caused supply limitations and made
production adjustments and temporary halts
unavoidable. Despite the difficult conditions,
Toyota launched new products that clearly speak
to the needs of consumers in Japan and around
the world. One such new model was a compact-
class dedicated hybrid vehicle that achieves
world-class fuel economy. We also launched a
next-generation sports car that pursues pure
driving enjoyment. In addition, Toyota worked
with dealers throughout the world to actively
develop sales initiatives.
As a result, consolidated vehicle sales both
in Japan and overseas
(
including Daihatsu and
Hino
)
reached 7,352 thousand units, an increase
of 44 thousand units, or 0.6%, over the previous
fiscal year. Consolidated vehicle production also
increased, rising by 266 thousand units, or 3.7%
year-on-year, to 7,435 thousand units.
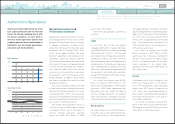
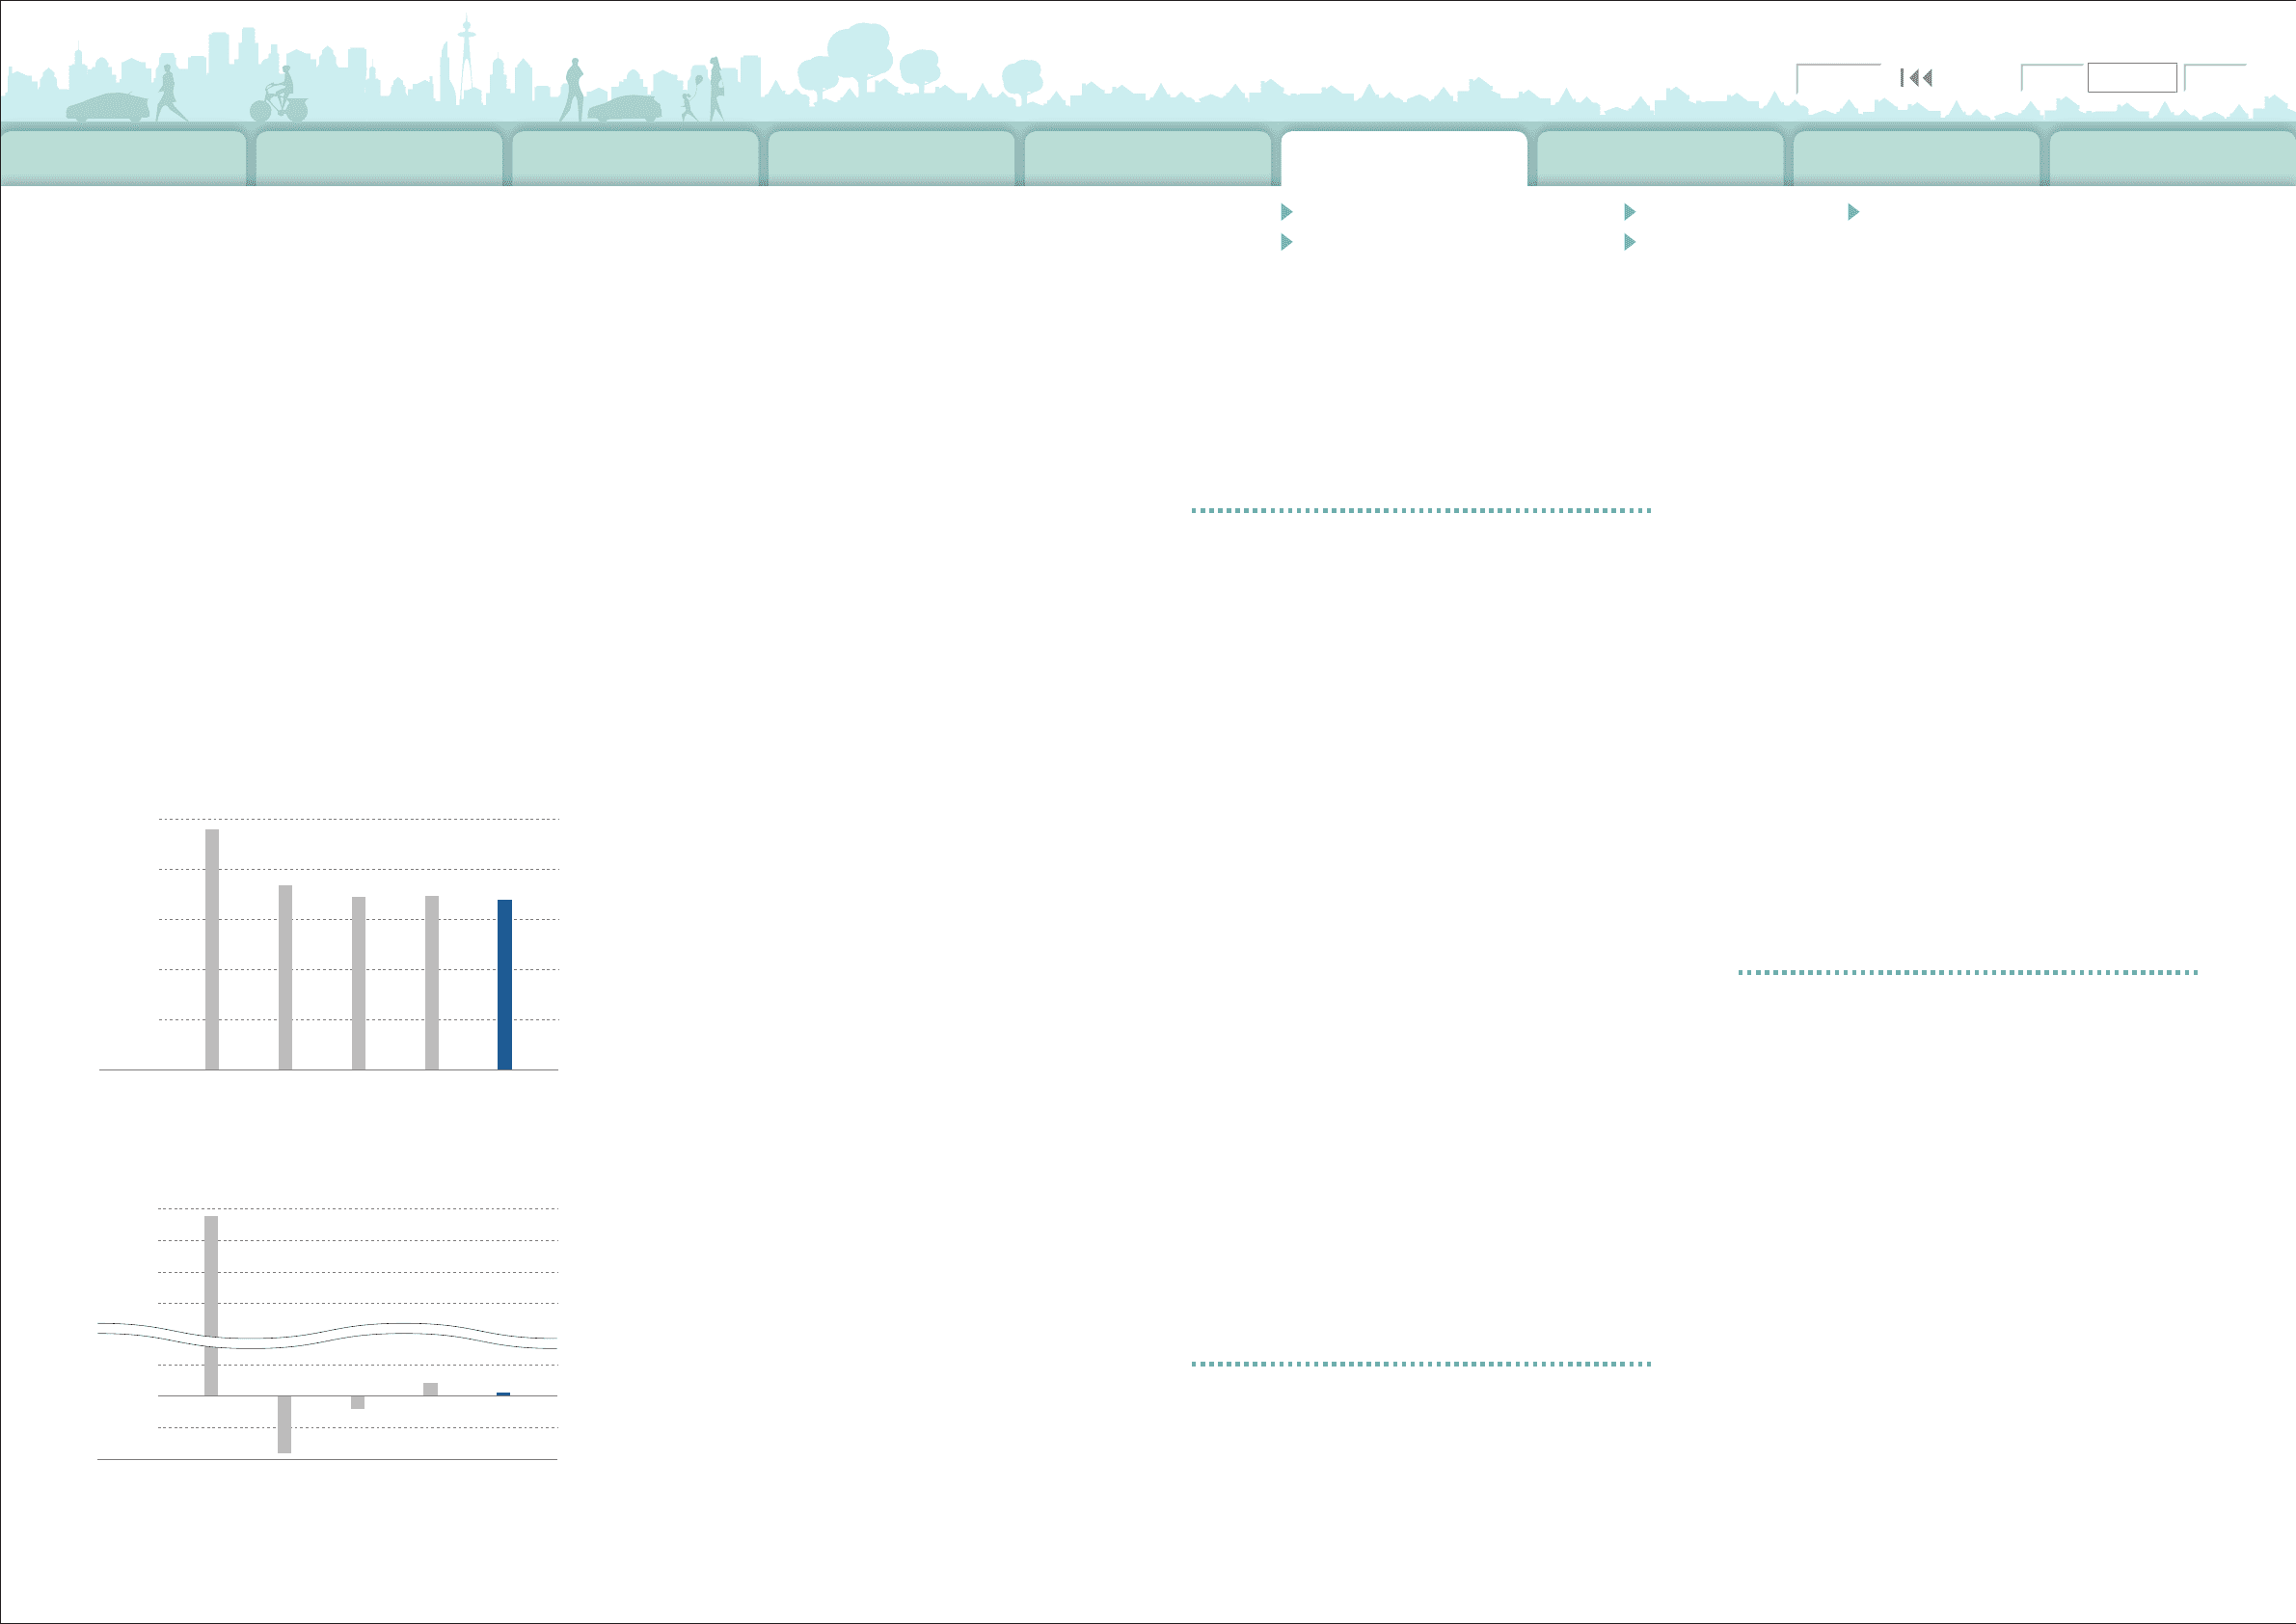
Net revenues decreased ¥342.7 billion, or
2.0% year-on-year, to ¥16,994.5 billion. Despite
cost-reduction efforts, due to the impact of
currency exchange fluctuations operating
income was down ¥64.3 billion or 74.8%
Japan
North America
Europe
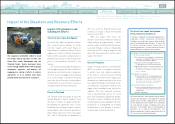
Toyota was heavily impacted by the Great
East Japan Earthquake and the Thailand
floods, but through combined efforts with
our group companies, we were able to
return to normal operations quicker than
originally expected. Toyota remained able to
build better cars that exceed expectations,
even under such harsh conditions.
0
5,000
10,000
15,0 00
20,000
25,000
‘08‘12‘11‘10‘09
(¥ Billion)
Net Revenues
‘08‘12‘11‘10‘09
0
200
-400
-200
1,800
1,600
2,0 00
2,2 00
(¥ Billion)
Operating Income
Note: Fiscal years ended March 31
Market Environment and
Performance Summary
Search NextPrev page 24
Contents
0821
Automotive Operations Financial Services OperationsConsolidated Performance Highlights
Non-automotive Business Operations Impact of the Disasters and Recovery Efforts