Toyota 2012 Annual Report Download - page 108
Download and view the complete annual report
Please find page 108 of the 2012 Toyota annual report below. You can navigate through the pages in the report by either clicking on the pages listed below, or by using the keyword search tool below to find specific information within the annual report.-
 1
1 -
2
-
3
-
4
-
5
-
6
-
7
-
8
-
9
-
10
-
11
-
12
-
13
-
14
-
15
-
16
-
17
-
18
-
19
-
20
-
21
-
22
-
23
-
24
-
25
-
26
-
27
-
28
-
29
-
30
-
31
-
32
-
33
-
34
-
35
-
36
-
37
-
38
-
39
-
40
-
41
-
42
-
43
-
44
-
45
-
46
-
47
-
48
-
49
-
50
-
51
-
52
-
53
-
54
-
55
-
56
-
57
-
58
-
59
-
60
-
61
-
62
-
63
-
64
-
65
-
66
-
67
-
68
-
69
-
70
-
71
-
72
-
73
-
74
-
75
-
76
-
77
-
78
-
79
-
80
-
81
-
82
-
83
-
84
-
85
-
86
-
87
-
88
-
89
-
90
-
91
-
92
-
93
-
94
-
95
-
96
-
97
-
 98
98 -
 99
99 -
 100
100 -
 101
101 -
 102
102 -
 103
103 -
 104
104 -
 105
105 -
 106
106 -
 107
107 -
 108
108 -
 109
109 -
 110
110 -
 111
111 -
 112
112 -
 113
113 -
 114
114 -
 115
115 -
 116
116 -
 117
117 -
 118
118 -
119
-
120
-
121
-
122
-
123
-
124
-
125
-
126
-
127
 |
 |
TOYOTA ANNUAL REPORT 2012
Toyota Global Vision Changes for Making
Ever-Better Cars President
ʼ
s Message Medium- to Long-Term
Growth Initiatives Special Feature Management and
Corporate Information Investor Information
Business and
Performance Review Financial Section
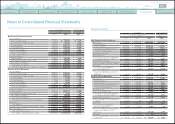
Notes to Consolidated Financial Statements
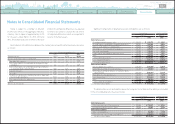
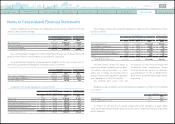
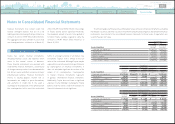
The following table summarizes the notional amounts of derivative financial instruments as of
March 31, 2011 and 2012:
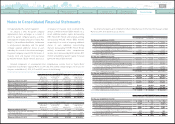
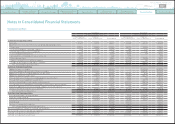
The following table summarizes the gains and losses on derivative financial instruments and hedged
items reported in the consolidated statement of income for the years ended March 31, 2010, 2011 and 2012:
Yen in millions
U.S. dollars in millions
March 31, March 31,
2011 2012 2012
Designated
derivative
financial
instruments
Undesignated
derivative
financial
instruments
Designated
derivative
financial
instruments
Undesignated
derivative
financial
instruments
Designated
derivative
financial
instruments
Undesignated
derivative
financial
instruments
Interest rate and
currency swap
agreements ¥ 617,472 ¥ 11,460,275 ¥ 344,623 ¥ 10,607,666 $ 4,193 $ 129,063
Foreign exchange
forward and
option contracts
—
1,176,955
̶
2,199,627
̶
26,762
Total ¥ 617,472 ¥ 12,637,230 ¥ 344,623 ¥ 12,807,293 $ 4,193 $ 155,825
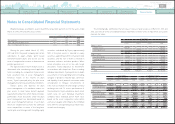
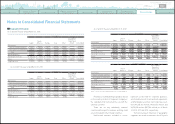
Yen in millions
For the years ended March 31,
2010 2011
Gains or
(
losses
)
on
derivative
financial
instruments
Gains or
(
losses
)
on
hedged
items
Gains or
(
losses
)
on
derivative
financial
instruments
Gains or
(
losses
)
on
hedged
items
Derivative financial instruments designated as
hedging instruments - Fair value hedge
Interest rate and currency swap agreements
Cost of financing operations ¥138,677 ¥
(
135,163
)
¥ 71,491 ¥
(
68,741
)
Interest expense
(
265
)
265
(
166
)
166
Undesignated derivative financial instruments
Interest rate and currency swap agreements
Cost of financing operations ¥ 77,939 ¥
—
¥ 72,082 ¥
—
Foreign exchange gain
(
loss
)
, net
(
2,819
)—
(
1,393
)—
Foreign exchange forward and option contracts
Cost of financing operations
(
21,841
)—
(
2,693
)—
Foreign exchange gain
(
loss
)
, net 60,599
—
110,211
—
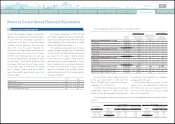
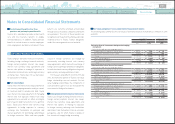
Yen in millions U.S. dollars in millions
For the year ended March 31, For the year ended March 31,
2012 2012
Gains or
(
losses
)
on
derivative
financial
instruments
Gains or
(
losses
)
on
hedged
items
Gains or
(
losses
)
on
derivative
financial
instruments
Gains or
(
losses
)
on
hedged
items
Derivative financial instruments designated as
hedging instruments - Fair value hedge
Interest rate and currency swap agreements
Cost of financing operations ¥
(
1,354
)
¥ 2,999 $
(
16
)
$ 36
Interest expense
̶
̶
̶
̶
Undesignated derivative financial instruments
Interest rate and currency swap agreements
Cost of financing operations ¥ 35,834 ¥
̶
$ 436 $
̶
Foreign exchange gain
(
loss
)
, net
(
28
)̶
(
0
)̶
Foreign exchange forward and option contracts
Cost of financing operations
(
3,815
)̶
(
46
)̶
Foreign exchange gain
(
loss
)
, net 53,272
̶
648
̶
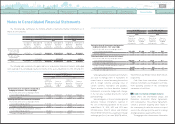
Undesignated derivative financial instruments
are used to manage risks of fluctuations in
interest rates to certain borrowing transactions
and in foreign currency exchange rates of
certain currency receivables and payables.
Toyota accounts for these derivative financial
instruments as economic hedges with changes
in the fair value recorded directly into current
period earnings.
Unrealized gains or
(
losses
)
on undesignated
derivative financial instruments reported in
the cost of financing operations for the years
ended March 31, 2010, 2011 and 2012 were
¥71,538 million, ¥93,370 million and ¥
(
14,934
)
million
(
$
(
182
)
million
)
those reported in foreign
exchange gain
(
loss
)
, net were ¥
(
26,476
)
million,
¥
(
240
)
million and ¥
(
5,543
)
million
(
$
(
67
)
million
)
,
respectively.
Cash flows from transactions of derivative
financial instruments are included in cash flows
from operating activities in the consolidated
statements of cash flows.
Toyota enters into International Swaps and
Derivatives Association Master Agreements
with counterparties. These Master Agreements
contain a provision requiring either Toyota or
the counterparty to settle the contract or to post
assets to the other party in the event of a ratings
downgrade below a specified threshold.
The aggregate fair value amount of derivative
■
Credit risk related contingent features
0820
Search NextPrev page 108
Contents