Toyota 2012 Annual Report Download - page 54
Download and view the complete annual report
Please find page 54 of the 2012 Toyota annual report below. You can navigate through the pages in the report by either clicking on the pages listed below, or by using the keyword search tool below to find specific information within the annual report.-
 1
1 -
2
-
3
-
4
-
5
-
6
-
7
-
8
-
9
-
10
-
11
-
12
-
13
-
14
-
15
-
16
-
17
-
18
-
19
-
20
-
21
-
22
-
23
-
24
-
25
-
26
-
27
-
28
-
29
-
30
-
31
-
32
-
33
-
34
-
35
-
36
-
37
-
38
-
39
-
40
-
41
-
42
-
43
-
 44
44 -
 45
45 -
 46
46 -
 47
47 -
 48
48 -
 49
49 -
 50
50 -
 51
51 -
 52
52 -
 53
53 -
 54
54 -
 55
55 -
 56
56 -
 57
57 -
 58
58 -
 59
59 -
 60
60 -
 61
61 -
 62
62 -
 63
63 -
 64
64 -
65
-
66
-
67
-
68
-
69
-
70
-
71
-
72
-
73
-
74
-
75
-
76
-
77
-
78
-
79
-
80
-
81
-
82
-
83
-
84
-
85
-
86
-
87
-
88
-
89
-
90
-
91
-
92
-
93
-
94
-
95
-
96
-
97
-
98
-
99
-
100
-
101
-
102
-
103
-
104
-
105
-
106
-
107
-
108
-
109
-
110
-
111
-
112
-
113
-
114
-
115
-
116
-
117
-
118
-
119
-
120
-
121
-
122
-
123
-
124
-
125
-
126
-
127
 |
 |

TOYOTA ANNUAL REPORT 2012
Toyota Global Vision Changes for Making
Ever-Better Cars President
ʼ
s Message Medium- to Long-Term
Growth Initiatives Special Feature Management and
Corporate Information Investor Information
Business and
Performance Review Financial Section
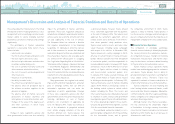
Management's Discussion and Analysis of Financial Condition and Results of Operations
such as Asia have developed in a steady manner.
Under these automotive market conditions,
despite the Great East Japan Earthquake and the
flood in Thailand, Toyota
ʼ
s consolidated vehicle
unit sales increased to 7,352 thousand vehicles
by 0.6% compared with the prior fiscal year.
Toyota had net revenues for fiscal 2012 of
¥18,583.6 billion, a decrease of ¥410.0 billion,
or 2.2%, compared with the prior fiscal year.
This decrease reflects unfavorable impact of
fluctuations in foreign currency translation rates
and others of ¥717.7 billion, partially offset by
changes in numbers of the vehicle unit sales
and sales mix of approximately ¥320.0 billion
and other factors. Excluding the difference in the
Japanese yen value used for translation purposes
of ¥717.7 billion, net revenues would have been
approximately ¥19,301.3 billion during fiscal
2012, a 1.6% increase compared with the prior
fiscal year. The automotive market in fiscal 2012
increased by 9.7% in North America and 3.9% in
Asia compared with the prior fiscal year due to
that market in the U.S. and emerging countries
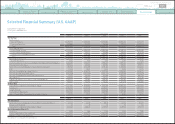
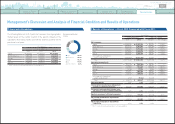
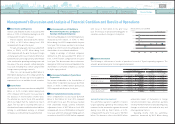
The table below shows Toyota
ʼ
s net revenues from external customers by product category and by
business.
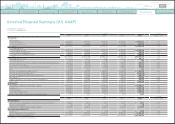
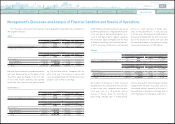
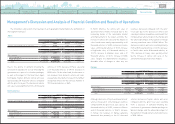
The following table shows the number of financing contracts by geographic region at the end of the
fiscal 2012 and 2011, respectively.
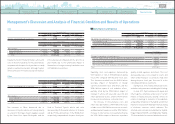
■
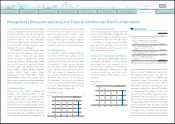
Net Revenues
‘12‘09 ‘10
‘08
‘11
0
5,000
10,000
15,0 0 0
20,000
25,000
(¥ Billion)
Net Revenues
the prior fiscal year. The increase in net revenues
from sales of products is due to an increase in
Toyota vehicle unit sales by 44 thousand vehicles.
Excluding the difference in the Japanese yen value
used for translation purposes of ¥66.9 billion,
net revenues from financial services operations
would have been approximately ¥1,138.6 billion,
a 2.9% decrease during fiscal 2012 compared
with the prior fiscal year. This decrease was
mainly due to the decrease of ¥18.3 billion rental
revenue generated by vehicles and equipment on
operating lease.
translation purposes of ¥717.7 billion, net revenues
in fiscal 2012 would have decreased by 5.1% in
North America, and would have increased by 1.6%
in Japan, 5.3% in Europe, 3.8% in Asia and 1.7% in
Other compared with the prior fiscal year.
Toyota
ʼ
s net revenues include net revenues
from sales of products, consisting of net
revenues from automotive operations and all
other operations, which decreased by 1.7% during
fiscal 2012 compared with the prior fiscal year to
¥17,511.9 billion, and net revenues from financial
services operations which decreased by 8.6%
during fiscal 2012 compared with the prior fiscal
year to ¥1,071.7 billion. Excluding the difference
in the Japanese yen value used for translation
purposes of ¥650.8 billion, net revenues from sales
of products would have been ¥18,162.7 billion, a
1.9% increase during fiscal 2012 compared with
Geographically, net revenues
(
before the
elimination of intersegment revenues
)
for fiscal
2012 decreased by 12.5% in North America, 1.2%
in Asia, and 2.7% in Other, whereas net revenues
increased by 1.6% in Japan and 0.6% in Europe
compared with the prior fiscal year. Excluding
the difference in the Japanese yen value used for
Yen in millions
Year ended March 31, 2012 vs. 2011 Change
2011 2012 Amount Percentage
Vehicles ¥ 14,507,479 ¥ 14,164,940 ¥
(
342,539
)
-
2.4%
Parts and components for overseas production 335,366 338,000 2,634 +0.8%
Parts and components for after service 1,553,497 1,532,219
(
21,278
)
-
1.4%
Other 926,411 929,219 2,808 +0.3%
Total Automotive 17,322,753 16,964,378
(
358,375
)
-
2.1%
All Other 497,767 547,538 49,771 +10.0%
Total sales of products 17,820,520 17,511,916
(
308,604
)
-
1.7%
Financial services 1,173,168 1,071,737
(
101,431
)
-
8.6%
Total ¥ 18,993,688 ¥ 18,583,653 ¥
(
410,035
)
-
2.2%
Number of financing contracts in thousands
Year ended March 31, 2012 vs. 2011 Change
2011 2012 Amount Percentage
Japan 1,709 1,697
(
12
)
-
0.7%
North America 4,654 4,535
(
119
)
-
2.6%
Europe 790 796 6+0.7%
Asia 522 649 127 +24.3%
Other* 527 552 25 +4.9%
Total 8,202 8,229 27 +0.3%
*
“
Other
”
consists of Central and South America, Oceania and Africa.
0820
Search NextPrev page 54
Contents