Toyota 2012 Annual Report Download - page 68
Download and view the complete annual report
Please find page 68 of the 2012 Toyota annual report below. You can navigate through the pages in the report by either clicking on the pages listed below, or by using the keyword search tool below to find specific information within the annual report.-
 1
1 -
2
-
3
-
4
-
5
-
6
-
7
-
8
-
9
-
10
-
11
-
12
-
13
-
14
-
15
-
16
-
17
-
18
-
19
-
20
-
21
-
22
-
23
-
24
-
25
-
26
-
27
-
28
-
29
-
30
-
31
-
32
-
33
-
34
-
35
-
36
-
37
-
38
-
39
-
40
-
41
-
42
-
43
-
44
-
45
-
46
-
47
-
48
-
49
-
50
-
51
-
52
-
53
-
54
-
55
-
56
-
57
-
 58
58 -
 59
59 -
 60
60 -
 61
61 -
 62
62 -
 63
63 -
 64
64 -
 65
65 -
 66
66 -
 67
67 -
 68
68 -
 69
69 -
 70
70 -
 71
71 -
 72
72 -
 73
73 -
 74
74 -
 75
75 -
 76
76 -
 77
77 -
 78
78 -
79
-
80
-
81
-
82
-
83
-
84
-
85
-
86
-
87
-
88
-
89
-
90
-
91
-
92
-
93
-
94
-
95
-
96
-
97
-
98
-
99
-
100
-
101
-
102
-
103
-
104
-
105
-
106
-
107
-
108
-
109
-
110
-
111
-
112
-
113
-
114
-
115
-
116
-
117
-
118
-
119
-
120
-
121
-
122
-
123
-
124
-
125
-
126
-
127
 |
 |

TOYOTA ANNUAL REPORT 2012
Toyota Global Vision Changes for Making
Ever-Better Cars President
ʼ
s Message Medium- to Long-Term
Growth Initiatives Special Feature Management and
Corporate Information Investor Information
Business and
Performance Review Financial Section
Management's Discussion and Analysis of Financial Condition and Results of Operations
intensified all over the world, as shown in the
small and low-price vehicles market, Toyota
expects the automotive market to expand
mainly in emerging countries in the future. In
addition, heightened global awareness of the
environment is leading to growing demand and
diversification for the environmentally-friendly
vehicles. With the foregoing external factors in
mind, Toyota expects that net revenues for fiscal
2013 will increase compared with fiscal 2012 as
a result of an increase in vehicle unit sales. With
respect to operating income, factors expected
to contribute to an increase in operating income
include increased vehicle unit sales through
marketing efforts, and cost reduction efforts. On
the other hand, factors expected to contribute
to a decrease in operating income include
increase in miscellaneous costs and others. As
a result, Toyota expects that operating income
will increase in fiscal 2013 compared with fiscal
2012. Also, Toyota expects that income before
income taxes and equity in earnings of affiliated
facilities, and the introduction of new products.
See
“
Information on the Company
—
Business
Overview
—
Capital Expenditures and
Divestitures
”
in Toyota
ʼ
s annual report on Form
20-F for information regarding Toyota
ʼ
s material
capital expenditures and divestitures for fiscal
2010, 2011 and 2012, and information concerning
Toyota
ʼ
s principal capital expenditures and
divestitures currently in progress.
Toyota funds its financing programs for
customers and dealers, including loans and
leasing programs, from both cash generated by
operations and borrowings by its sales finance
subsidiaries. Toyota seeks to expand its ability
to raise funds locally in markets throughout
the world by expanding its network of finance
subsidiaries.
companies and net income attributable to Toyota
Motor Corporation will increase in fiscal 2013.
For the purposes of this outlook discussion,
Toyota is assuming an average exchange rate of ¥80
to the U.S. dollar and ¥105 to the euro. Exchange
rate fluctuations can materially affect Toyota
ʼ
s
operating results. In particular, a strengthening of
the Japanese yen against the U.S. dollar can have
a material adverse effect on Toyota
ʼ
s operating
results. See
“
Operating and Financial Review and
Prospects
—
Operating Results
—
Overview
—
Currency Fluctuations
”
for further discussion.
The foregoing statements are forward-looking
statements based upon Toyota
ʼ
s management
ʼ
s
assumptions and beliefs regarding exchange rates,
market demand for Toyota
ʼ
s products, economic
conditions and others. See
“
Cautionary Statement
Concerning Forward-Looking Statements
”
. Toyota
ʼ
s
actual results of operations could vary significantly
from those described above as a result of unanticipated
changes in the factors described above or other
factors, including those described in
“
Risk Factors.
”
Toyota refrained from repurchasing of its
own shares for fiscal 2010, 2011 and 2012. Toyota
has decided, for the time being, to refrain from
repurchasing its own shares, in order to prioritize
retention of cash reserves given the continued
uncertainties surrounding future global economy.
Net cash provided by operating activities
was ¥1,452.4 billion for fiscal 2012, compared
with ¥2,024.0 billion for the prior fiscal year.
The decrease was due to a reduction in cash
collection received from sale of products due
to a decrease in net revenue for the automotive
operations, partially offset by operating activities
resulted from a decrease in cash payment to
suppliers attributable to a decrease in cost of
products sold in the automotive operations.
Net cash used in investing activities was
Historically, Toyota has funded its capital
expenditures and research and development
activities through cash generated by operations.
However, in the interest of preserving a stable
and healthy business environment and a strong
financial position going forward, Toyota raised
certain funds from debt during fiscal 2012.
In fiscal 2013, Toyota expects to sufficiently
fund its capital expenditures and research and
development activities through cash and cash
equivalents on hand, and cash generated by
operations. Toyota will use its funds for the
development of environment technologies,
maintenance and replacement of manufacturing
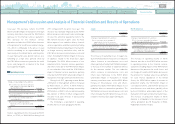
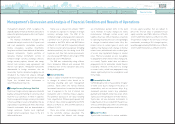
Liquidity And Capital Resources
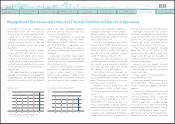
0
1,000
2,000
3,000
4,000
‘08‘12‘10‘09 ‘11
0
500
1,000
1,500
‘08 ‘12‘10‘09 ‘11
0
500
1,000
1,500
2,500
2,000
‘08 ‘12‘11‘10‘09
Net cash provided by
operating activities
Free cash flow
Capital expenditures
Depreciation
(¥ Billion) (¥ Billion) (¥ Billion)
Net Cash Provided by
Operating Activities and
Free Cash Flow*
Capital Expenditures for Property,
Plant and Equipment* and
Depreciation
Cash and Cash Equivalents
at End of Year
*
(
Net cash provided by operating activities
)
-
(
Capital expenditures for property, plant and
equipment, excluding vehicles and
equipment on operating leases
)
* Excluding vehicles and equipment on
operating leases
0820
Search NextPrev page 68
Contents