Toyota 2012 Annual Report Download - page 44
Download and view the complete annual report
Please find page 44 of the 2012 Toyota annual report below. You can navigate through the pages in the report by either clicking on the pages listed below, or by using the keyword search tool below to find specific information within the annual report.-
 1
1 -
2
-
3
-
4
-
5
-
6
-
7
-
8
-
9
-
10
-
11
-
12
-
13
-
14
-
15
-
16
-
17
-
18
-
19
-
20
-
21
-
22
-
23
-
24
-
25
-
26
-
27
-
28
-
29
-
30
-
31
-
32
-
33
-
 34
34 -
 35
35 -
 36
36 -
 37
37 -
 38
38 -
 39
39 -
 40
40 -
 41
41 -
 42
42 -
 43
43 -
 44
44 -
 45
45 -
 46
46 -
 47
47 -
 48
48 -
 49
49 -
 50
50 -
 51
51 -
 52
52 -
 53
53 -
 54
54 -
55
-
56
-
57
-
58
-
59
-
60
-
61
-
62
-
63
-
64
-
65
-
66
-
67
-
68
-
69
-
70
-
71
-
72
-
73
-
74
-
75
-
76
-
77
-
78
-
79
-
80
-
81
-
82
-
83
-
84
-
85
-
86
-
87
-
88
-
89
-
90
-
91
-
92
-
93
-
94
-
95
-
96
-
97
-
98
-
99
-
100
-
101
-
102
-
103
-
104
-
105
-
106
-
107
-
108
-
109
-
110
-
111
-
112
-
113
-
114
-
115
-
116
-
117
-
118
-
119
-
120
-
121
-
122
-
123
-
124
-
125
-
126
-
127
 |
 |
TOYOTA ANNUAL REPORT 2012
Toyota Global Vision Changes for Making
Ever-Better Cars President
ʼ
s Message Medium- to Long-Term
Growth Initiatives Special Feature Management and
Corporate Information Investor Information
Business and
Performance Review Financial Section
towards future growth as well as to maintain the necessary level of working
capital, even during difficult business environments such as steep price
increases in raw materials or drastic foreign exchange rate fluctuations, not
to mention such unexpected crises as last year
ʼ
s earthquake and the Thailand
floods. Although the business environments surrounding us remain unclear due
to factors such as the European sovereign debt crisis, we anticipate medium-
to long-term growth in automotive markets worldwide. We believe that
maintaining adequate liquidity is essential to the implementation of forward-
looking investment to improve product appeal and develop next-generation
technologies, as well as to establish a structure for production and sales in both
the Japanese and overseas markets in addition to the crisis measures. We will
continue to pursue further capital efficiency and improved cash flows.
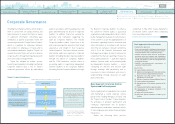
We deem the benefit of its shareholders as one of its priority management
policies, and it is working to improve corporate structure towards the realization
of sustainable growth in order to enhance its corporate value. We will strive to
continue to pay stable dividends while giving due consideration to factors such
as business results for each term, investment plans and its cash reserves. In
order to succeed in this highly competitive industry, we plan to utilize its internal
funds for the early commercialization of technologies for next-generation
environment and safety, giving priority to customer safety and sense of security.
Considering these factors, we declared an annual dividend payment of ¥50 per
share for the fiscal year ended March 31, 2012.
Given the uncertain outlook for the present business environment, we
will prioritize securing cash reserves. Accordingly, we did not repurchase our
own shares in the fiscal year ended March 31, 2012, and we plan to forgo such
repurchases for the foreseeable future.
We will continue striving to further improve profits and meet the
expectations of our shareholders.
July 2012
Financial Strategy
Dividends and Share Acquisitions
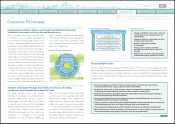
The three key components of our financial strategy are growth, efficiency and
stability.
We believe that the balanced pursuit of these three priorities over the
medium to long term will allow us to achieve steady and sustainable growth,
as well as increase corporate value.
We believe that automotive markets worldwide will grow over the medium
to long-term. As they expand, the center of market growth will shift toward
fuel-efficient vehicles, such as hybrid vehicles and compact vehicles, and toward
resource-rich and emerging markets. We plan to invest efficiently and actively
in these areas to respond to structural shifts in demand and ensure long-term
sustainable growth. We will expand our lineup of hybrids and other eco-cars
and develop it globally, while making efforts to increase sales in emerging
markets by working to strengthen locally-produced core models, such as IMVs
and newly developed subcompact models. I believe we should work to realize a
geographically balanced business structure, i.e., the
“
50:50 sales ratio between
Japan/U.S./Europe and emerging markets
”
defined in Toyota Global Vision.
To meet ongoing demand for hybrid and compact vehicles, we aim to provide
high-quality vehicles at affordable prices and to improve profitability through
further cost reductions. The introduction of our new framework for developing
“
better cars
,”
called the Toyota New Global Architecture
(
TNGA
)
, will enable us
to achieve sweeping advances in product appeal with cost reductions, in addition
to strengthening design and development. We can invest efficiently and achieve
the same equipment investment benefit with lower capital expenditure. Through
such efforts, we will strive for efficient investment that emphasizes the areas
where we want to advance, such as eco-cars, including hybrids, and emerging
markets, which are expected to grow, while improving our income structure.
We preserve a solid financial base by ensuring sufficient liquidity and stable
shareholders
ʼ
equity. Such a sound financial position enables us to maintain a
level of capital expenditures and investment in research and development geared
1.
Growth: Sustainable growth through continuous forward-looking investments
2. Efficiency: Improving profitability and capital efficiency
3. Stability: Maintaining a solid financial base
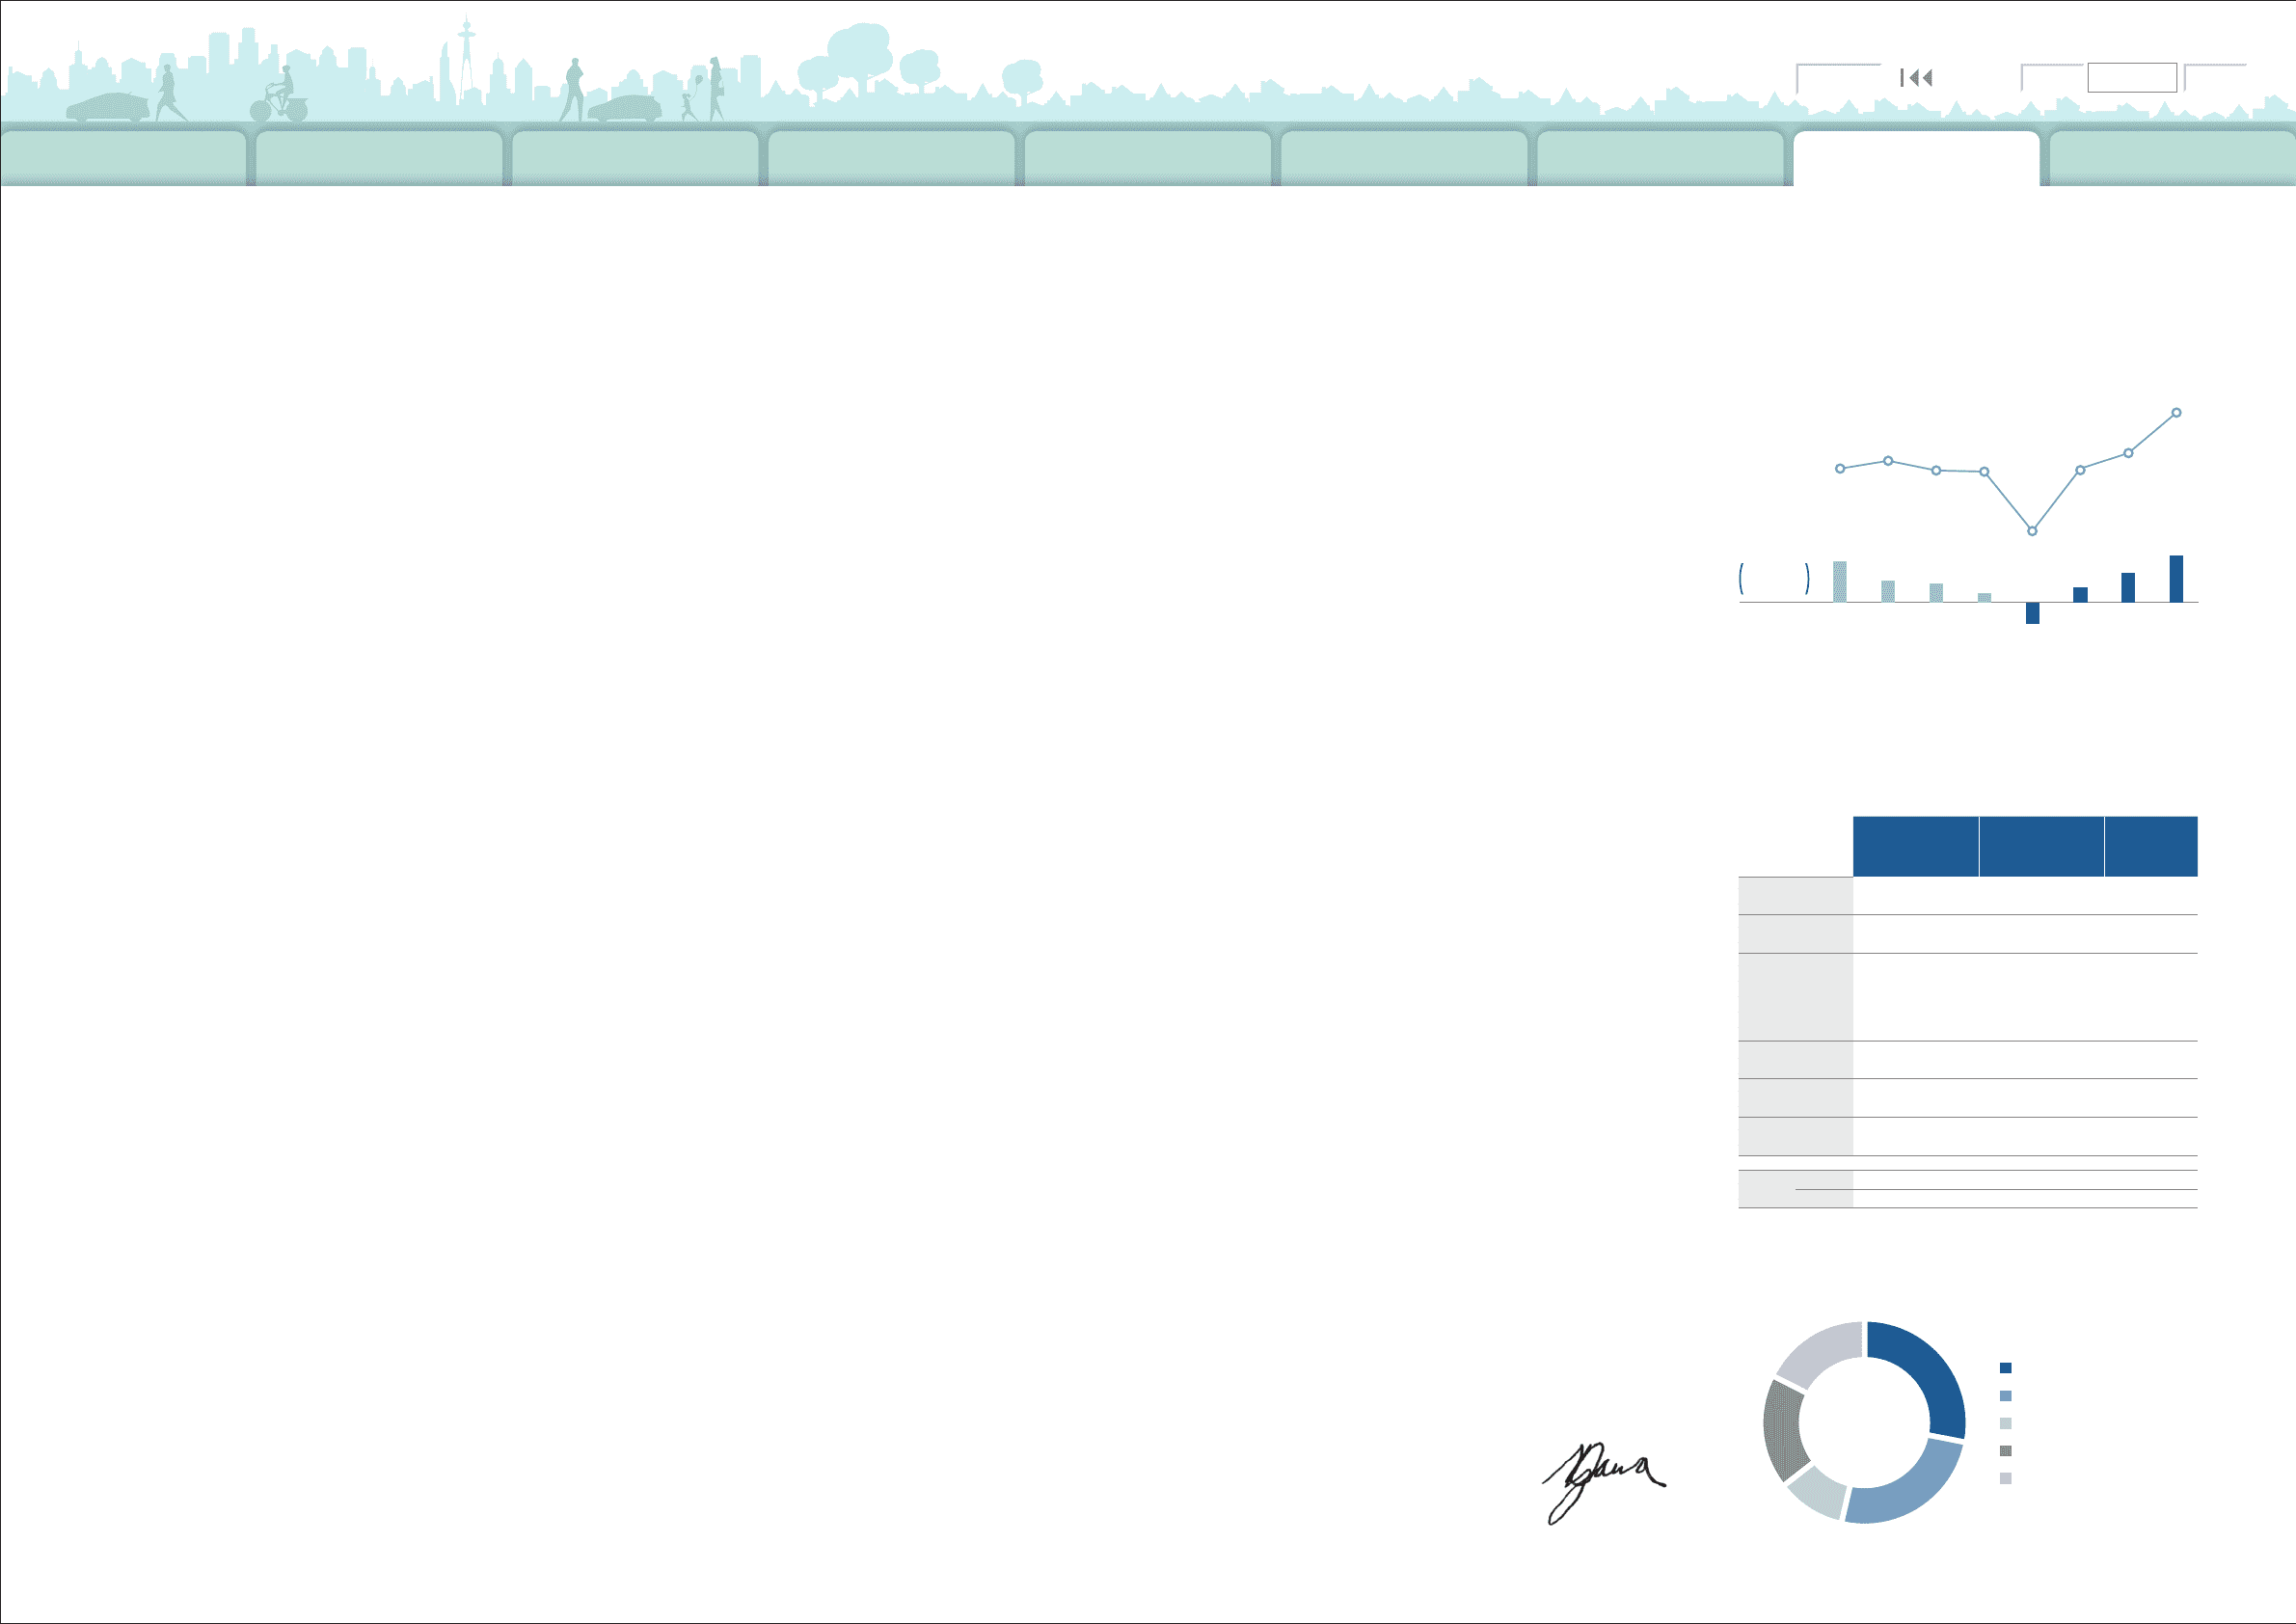
Consolidated
Vehicle Sales
Operating
Income
(Billion)
(Thousands of units)
Yen/€
Yen/U.S. $
Exchange Rates
4Q3Q2Q1Q
FY2011 FY2012
4Q3Q2Q1Q
211.6
(4.3%)
1,820 1,895 1,802 1,791
1,221
1,805
1,969
2,357
111.5
(2.3%)99.0
(2.1%)46.1
(1.0%)-108.0
(-3.1%)
75.4
(1.6%)
149.6
(3.1%)
238.5
(4,2%)
7977788282838692
104104110117113112111117
Operating
Income Ratio
Quarterly Operating Income
Japan 28.2%
North America 25.5%
Europe 10.8%
Asia 18.0%
Other 17.5%
Vehicle Sales by Region
FY2013 Consolidated Financial Forecasts
(
¥ Billion
)
FY2013 Forecasts
April 1, 2012-
March 31, 2013
FY2012 Results
April 1, 2011-
March 31, 2012
Change
Net Revenues 22,000.0 18,583.6 3,416.4
Operating
Income 1,000.0 355.6 644.4
Income before
Income Taxes and
Equity in Earnings
of Affiliated
Companies
1,160.0 432.8 727.2
Net Income
*
760.0 283.5 476.5
Capital
Expenditures 820.0 706.7 113.3
R&D
Expenses 810.0 779.8 30.2
Exchange
Rates
Yen/U.S. $
80 79 +1
Yen/€
105 109
-
4
* Net income attributable to Toyota Motor Corporation
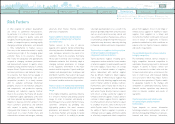
Satoshi Ozawa,
Executive Vice President
Message from the Executive Vice President Responsible for Accounting
0820
Search NextPrev page 44
Contents