Toyota 2012 Annual Report Download - page 118
Download and view the complete annual report
Please find page 118 of the 2012 Toyota annual report below. You can navigate through the pages in the report by either clicking on the pages listed below, or by using the keyword search tool below to find specific information within the annual report.-
 1
1 -
2
-
3
-
4
-
5
-
6
-
7
-
8
-
9
-
10
-
11
-
12
-
13
-
14
-
15
-
16
-
17
-
18
-
19
-
20
-
21
-
22
-
23
-
24
-
25
-
26
-
27
-
28
-
29
-
30
-
31
-
32
-
33
-
34
-
35
-
36
-
37
-
38
-
39
-
40
-
41
-
42
-
43
-
44
-
45
-
46
-
47
-
48
-
49
-
50
-
51
-
52
-
53
-
54
-
55
-
56
-
57
-
58
-
59
-
60
-
61
-
62
-
63
-
64
-
65
-
66
-
67
-
68
-
69
-
70
-
71
-
72
-
73
-
74
-
75
-
76
-
77
-
78
-
79
-
80
-
81
-
82
-
83
-
84
-
85
-
86
-
87
-
88
-
89
-
90
-
91
-
92
-
93
-
94
-
95
-
96
-
97
-
98
-
99
-
100
-
101
-
102
-
103
-
104
-
105
-
106
-
107
-
 108
108 -
 109
109 -
 110
110 -
 111
111 -
 112
112 -
 113
113 -
 114
114 -
 115
115 -
 116
116 -
 117
117 -
 118
118 -
 119
119 -
 120
120 -
 121
121 -
 122
122 -
 123
123 -
 124
124 -
 125
125 -
 126
126 -
 127
127
 |
 |
TOYOTA ANNUAL REPORT 2012
Toyota Global Vision Changes for Making
Ever-Better Cars President
ʼ
s Message Medium- to Long-Term
Growth Initiatives Special Feature Management and
Corporate Information Investor Information
Business and
Performance Review Financial Section
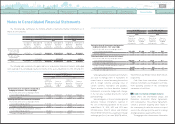
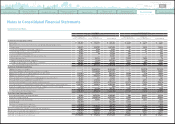
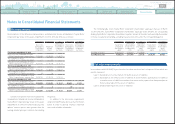
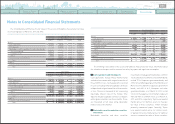
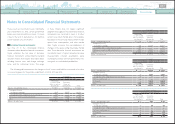
Notes to Consolidated Financial Statements
Statement of cash flows
Yen in millions Yen in millions
For the year ended March 31, 2010 For the year ended March 31, 2011
Non-Financial
Services Businesses Financial
Services Businesses Consolidated Non-Financial
Services Businesses Financial
Services Businesses Consolidated
Cash flows from operating activities
Net income ¥ 116,218 ¥ 128,106 ¥ 244,212 ¥ 241,448 ¥ 226,322 ¥ 465,485
Adjustments to reconcile net income to net cash provided by operating activities
Depreciation 1,065,749 348,820 1,414,569 844,708 330,865 1,175,573
Provision for doubtful accounts and credit losses 1,905 98,870 100,775 1,806 2,334 4,140
Pension and severance costs, less payments 55 1,199 1,254
(
24,867
)
1,453
(
23,414
)
Losses on disposal of fixed assets 46,661 276 46,937 36,076 138 36,214
Unrealized losses on available-for-sale securities, net 2,486
—
2,486 7,915
—
7,915
Deferred income taxes
(
14,183
)
39,759 25,537
(
17,258
)
103,035 85,710
Equity in
(
earnings
)
losses of affiliated
companies
(
109,944
)
64,536
(
45,408
) (
214,229
) (
787
) (
215,016
)
Changes in operating assets and liabilities, and other 733,338 133,275 768,168 591,378
(
106,416
)
487,402
Net cash provided by operating activities 1,842,285 814,841 2,558,530 1,466,977 556,944 2,024,009
Cash flows from investing activities
Additions to finance receivables
—
(
13,492,119
) (
7,806,201
)—
(
14,323,261
) (
8,438,785
)
Collection of and proceeds from sales of finance receivables
—
13,107,531 7,517,968
—
13,887,751 8,003,940
Additions to fixed assets excluding equipment leased to others
(
599,154
) (
5,382
) (
604,536
) (
621,302
) (
8,024
) (
629,326
)
Additions to equipment leased to others
(
64,345
) (
768,720
) (
833,065
) (
78,559
) (
983,306
) (
1,061,865
)
Proceeds from sales of fixed assets excluding equipment leased to others 46,070 6,403 52,473 50,742 600 51,342
Proceeds from sales of equipment leased to others 36,668 428,424 465,092 17,700 468,995 486,695
Purchases of marketable securities and security investments
(
2,310,912
) (
101,270
) (
2,412,182
) (
4,063,499
) (
358,308
) (
4,421,807
)
Proceeds from sales of and maturity of marketable securities and security investments 1,012,781 95,960 1,108,741 3,423,618 292,538 3,716,156
Payment for additional investments in affiliated companies, net of cash acquired
(
1,020
)—
(
1,020
) (
299
)—
(
299
)
Changes in investments and other assets, and other
(
259,089
)
102,497
(
337,454
)
394,479 18,303 177,605
Net cash used in investing activities
(
2,139,001
) (
626,676
) (
2,850,184
) (
877,120
) (
1,004,712
) (
2,116,344
)
Cash flows from financing activities
Proceeds from issuance of long-term debt 492,300 2,733,465 3,178,310 15,318 2,934,588 2,931,436
Payments of long-term debt
(
77,033
) (
2,926,308
) (
2,938,202
) (
309,862
) (
2,306,139
) (
2,489,632
)
Increase
(
decrease
)
in short-term borrowings
(
249,238
) (
251,544
) (
335,363
) (
86,884
)
122,619 162,260
Dividends paid
(
172,476
)—
(
172,476
) (
141,120
)—
(
141,120
)
Purchase of common stock, and other
(
10,251
)—
(
10,251
) (
28,617
)—
(
28,617
)
Net cash provided by
(
used in
)
financing activities
(
16,698
) (
444,387
) (
277,982
) (
551,165
)
751,068 434,327
Effect of exchange rate changes on cash and cash equivalents 4,092
(
12,990
) (
8,898
) (
76,960
) (
50,069
) (
127,029
)
Net increase
(
decrease
)
in cash and cash equivalents
(
309,322
) (
269,212
) (
578,534
) (
38,268
)
253,231 214,963
Cash and cash equivalents at beginning of year 1,648,143 796,137 2,444,280 1,338,821 526,925 1,865,746
Cash and cash equivalents at end of year ¥1,338,821 ¥ 526,925 ¥1,865,746 ¥1,300,553 ¥ 780,156 ¥2,080,709
0820
Search NextPrev page 118
Contents