Toyota 2012 Annual Report Download - page 114
Download and view the complete annual report
Please find page 114 of the 2012 Toyota annual report below. You can navigate through the pages in the report by either clicking on the pages listed below, or by using the keyword search tool below to find specific information within the annual report.-
 1
1 -
2
-
3
-
4
-
5
-
6
-
7
-
8
-
9
-
10
-
11
-
12
-
13
-
14
-
15
-
16
-
17
-
18
-
19
-
20
-
21
-
22
-
23
-
24
-
25
-
26
-
27
-
28
-
29
-
30
-
31
-
32
-
33
-
34
-
35
-
36
-
37
-
38
-
39
-
40
-
41
-
42
-
43
-
44
-
45
-
46
-
47
-
48
-
49
-
50
-
51
-
52
-
53
-
54
-
55
-
56
-
57
-
58
-
59
-
60
-
61
-
62
-
63
-
64
-
65
-
66
-
67
-
68
-
69
-
70
-
71
-
72
-
73
-
74
-
75
-
76
-
77
-
78
-
79
-
80
-
81
-
82
-
83
-
84
-
85
-
86
-
87
-
88
-
89
-
90
-
91
-
92
-
93
-
94
-
95
-
96
-
97
-
98
-
99
-
100
-
101
-
102
-
103
-
 104
104 -
 105
105 -
 106
106 -
 107
107 -
 108
108 -
 109
109 -
 110
110 -
 111
111 -
 112
112 -
 113
113 -
 114
114 -
 115
115 -
 116
116 -
 117
117 -
 118
118 -
 119
119 -
 120
120 -
 121
121 -
 122
122 -
 123
123 -
 124
124 -
125
-
126
-
127
 |
 |
TOYOTA ANNUAL REPORT 2012
Toyota Global Vision Changes for Making
Ever-Better Cars President
ʼ
s Message Medium- to Long-Term
Growth Initiatives Special Feature Management and
Corporate Information Investor Information
Business and
Performance Review Financial Section
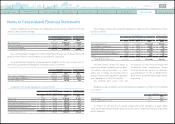
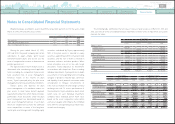
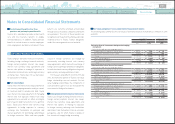
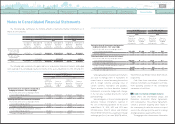
Notes to Consolidated Financial Statements
■
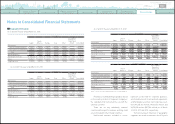
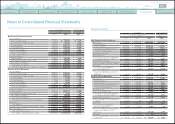
Segment operating results and assets
As of and for the year ended March 31, 2010:
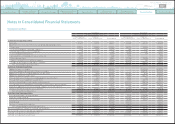
As of and for the year ended March 31, 2011:
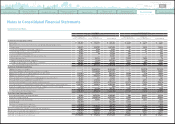
As of and for the year ended March 31, 2012:
Yen in millions
Automotive Financial
Services All Other
Inter-segment
Elimination/
Unallocated
Amount Consolidated
Net revenues
Sales to external customers ¥17,187,308 ¥ 1,226,244 ¥ 537,421 ¥
—
¥ 18,950,973
Inter-segment sales and transfers 10,120 19,163 410,194
(
439,477
)—
Total 17,197,428 1,245,407 947,615
(
439,477
)
18,950,973
Operating expenses 17,283,798 998,480 956,475
(
435,296
)
18,803,457
Operating income
(
loss
)
¥
(
86,370
)
¥ 246,927 ¥
(
8,860
)
¥
(
4,181
)
¥ 147,516
Assets ¥ 12,359,404 ¥ 13,274,953 ¥ 1,119,635 ¥ 3,595,295 ¥ 30,349,287
Investment in equity method investees 1,692,702 129,745
—
44,993 1,867,440
Depreciation expense 1,018,935 348,820 46,814
—
1,414,569
Capital expenditure 616,216 774,102 21,751 25,532 1,437,601
Yen in millions
Automotive Financial
Services All Other
Inter-segment
Elimination/
Unallocated
Amount Consolidated
Net revenues
Sales to external customers ¥17,322,753 ¥ 1,173,168 ¥ 497,767 ¥
—
¥ 18,993,688
Inter-segment sales and transfers 14,567 19,037 474,485
(
508,089
)—
Total 17,337,320 1,192,205 972,252
(
508,089
)
18,993,688
Operating expenses 17,251,347 833,925 937,010
(
496,873
)
18,525,409
Operating income ¥ 85,973 ¥ 358,280 ¥ 35,242 ¥
(
11,216
)
¥ 468,279
Assets ¥ 11,341,558 ¥ 13,365,394 ¥ 1,146,720 ¥ 3,964,494 ¥ 29,818,166
Investment in equity method investees 1,784,539 3,519 3,045 26,885 1,817,988
Depreciation expense 819,075 330,865 25,633
—
1,175,573
Capital expenditure 691,867 991,330 21,058
(
13,064
)
1,691,191
Yen in millions
Automotive Financial
Services All Other
Inter-segment
Elimination/
Unallocated
Amount Consolidated
Net revenues
Sales to external customers ¥ 16,964,378 ¥ 1,071,737 ¥ 547,538 ¥
̶
¥ 18,583,653
Inter-segment sales and transfers 30,168 28,587 501,377
(
560,132
)̶
Total 16,994,546 1,100,324 1,048,915
(
560,132
)
18,583,653
Operating expenses 16,972,863 793,886 1,006,853
(
545,576
)
18,228,026
Operating income ¥ 21,683 ¥ 306,438 ¥ 42,062 ¥
(
14,556
)
¥ 355,627
Assets ¥ 12,261,814 ¥ 13,172,548 ¥ 1,161,224 ¥4,055,379 ¥ 30,650,965
Investment in equity method investees 1,877,720 3,887 4,765 27,757 1,914,129
Depreciation expense 744,067 298,757 25,006
̶
1,067,830
Capital expenditure 796,839 683,161 35,340 16,742 1,532,082
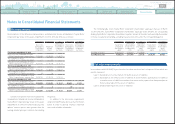
U.S. dollars in millions
Automotive Financial
Services All Other
Inter-segment
Elimination/
Unallocated
Amount Consolidated
Net revenues
Sales to external customers $ 206,404 $ 13,040 $ 6,662 $
̶
$ 226,106
Inter-segment sales and transfers 367 348 6,100
(
6,815
)̶
Total 206,771 13,388 12,762
(
6,815
)
226,106
Operating expenses 206,507 9,660 12,250
(
6,638
)
221,779
Operating income $ 264 $ 3,728 $ 512 $
(
177
)
$ 4,327
Assets $ 149,189 $ 160,269 $ 14,129 $ 49,341 $ 372,928
Investment in equity method investees 22,846 47 58 338 23,289
Depreciation expense 9,053 3,635 304
̶
12,992
Capital expenditure 9,695 8,312 430 204 18,641
0820
Search NextPrev page 114
Contents