Toyota 2012 Annual Report Download - page 56
Download and view the complete annual report
Please find page 56 of the 2012 Toyota annual report below. You can navigate through the pages in the report by either clicking on the pages listed below, or by using the keyword search tool below to find specific information within the annual report.-
 1
1 -
2
-
3
-
4
-
5
-
6
-
7
-
8
-
9
-
10
-
11
-
12
-
13
-
14
-
15
-
16
-
17
-
18
-
19
-
20
-
21
-
22
-
23
-
24
-
25
-
26
-
27
-
28
-
29
-
30
-
31
-
32
-
33
-
34
-
35
-
36
-
37
-
38
-
39
-
40
-
41
-
42
-
43
-
44
-
45
-
 46
46 -
 47
47 -
 48
48 -
 49
49 -
 50
50 -
 51
51 -
 52
52 -
 53
53 -
 54
54 -
 55
55 -
 56
56 -
 57
57 -
 58
58 -
 59
59 -
 60
60 -
 61
61 -
 62
62 -
 63
63 -
 64
64 -
 65
65 -
 66
66 -
67
-
68
-
69
-
70
-
71
-
72
-
73
-
74
-
75
-
76
-
77
-
78
-
79
-
80
-
81
-
82
-
83
-
84
-
85
-
86
-
87
-
88
-
89
-
90
-
91
-
92
-
93
-
94
-
95
-
96
-
97
-
98
-
99
-
100
-
101
-
102
-
103
-
104
-
105
-
106
-
107
-
108
-
109
-
110
-
111
-
112
-
113
-
114
-
115
-
116
-
117
-
118
-
119
-
120
-
121
-
122
-
123
-
124
-
125
-
126
-
127
 |
 |
TOYOTA ANNUAL REPORT 2012
Toyota Global Vision Changes for Making
Ever-Better Cars President
ʼ
s Message Medium- to Long-Term
Growth Initiatives Special Feature Management and
Corporate Information Investor Information
Business and
Performance Review Financial Section
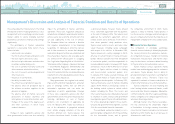
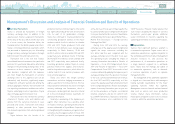
Management's Discussion and Analysis of Financial Condition and Results of Operations
flood in Thailand. Toyota
ʼ
s vehicle unit sales
decreased by 25 thousand vehicles in Oceania,
and by 19 thousand vehicles in the Middle East,
respectively, compared with the prior fiscal year.
quality related expenses and others. This cost
decreased because costs related to recalls and
other safety measures occurred at a high level
during the prior fiscal year. See note 14 to the
consolidated financial statements.
During fiscal 2012, Toyota announced recalls
and other safety measures including the following:
In June 2011, Toyota announced in Japan and
other regions a voluntary safety recall of certain
models of Toyota and Lexus brands
ʼ
vehicles in
relation to damage to elements of the substrate
and potential shutdown of the hybrid system that
may have resulted from improper manufacturing
of electronic converter control substrate. The
affected vehicle models included Harrier Hybrid,
Kluger Hybrid, RX400h, and Highlander Hybrid,
111 thousand vehicles were included in this recall.
in Asia decreased compared with the prior fiscal
year mainly due to the unfavorable impact of
fluctuations in foreign currency translation rates
of ¥168.8 billion and others.
Despite the flood in Thailand, Toyota
ʼ
s vehicle unit
sales in Asia increased by 72 thousand vehicles
compared with the prior fiscal year due to steady
growth in automotive markets. Although Toyota
ʼ
s
vehicle unit sales in Asia increased, net revenues
Net revenues in Other decreased due to
decreases in Toyota
ʼ
s vehicle unit sales primarily
as a result of shortages of parts supplies caused
by the Great East Japan Earthquake and the
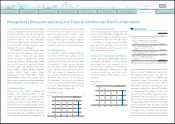
Operating costs and expenses decreased by
¥297.3 billion, or 1.6%, to ¥18,228.0 billion during
fiscal 2012 compared with the prior fiscal year.
This decrease resulted from the ¥432.3 billion
favorable impact of fluctuations in foreign
currency translation rates and others, and the
¥150.0 billion impact of cost reduction efforts,
partially offset by the ¥150.0 billion impact of
changes in vehicle unit sales and sales mix and
other operational factors and the ¥134.9 billion
increase in miscellaneous costs and others.
The increase in miscellaneous costs and
others was due mainly to a ¥100.0 billion increase
in labor costs, a ¥50.0 billion increase in research
and development expenses and the ¥104.9 billion
increase in other various costs, partially offset by
the ¥120.0 billion impact of decrease in product
■
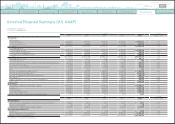
Operating Costs and Expenses
Yen in millions
Year ended March 31, 2012 vs. 2011 Change
2011 2012 Amount Percentage
Operating costs and expenses
Cost of products sold ¥ 15,985,783 ¥ 15,795,918 ¥
(
189,865
)
-
1.2%
Cost of financing operations 629,543 592,646
(
36,897
)
-
5.9%
Selling, general and administrative 1,910,083 1,839,462
(
70,621
)
-
3.7%
Total ¥ 18,525,409 ¥ 18,228,026 ¥
(
297,383
)
-
1.6%
Yen in millions
2012 vs. 2011 Change
Changes in operating costs and expenses:
Effect of changes in vehicle unit sales and sales mix and other operational factors
¥ 150,000
Effect of fluctuation in foreign currency translation rates and others
(
432,300
)
Effect of cost reduction efforts
(
150,000
)
Effect of increase in miscellaneous costs and others 134,917
Total ¥
(
297,383
)
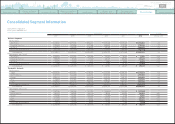
Other
Thousands of units
Year ended March 31, 2012 vs. 2011 Change
2011 2012 Amount Percentage
Toyota
ʼ
s consolidated vehicle unit sales 1,313 1,284
(
29
)
-
2.2%
Yen in millions
Year ended March 31, 2012 vs. 2011 Change
2011 2012 Amount Percentage
Net revenues:
Sales of products ¥1,694,680 ¥ 1,636,043 ¥
(
58,637
)
-
3.5%
Financial services 114,436 124,132 9,696 +8.5%
Total ¥1,809,116 ¥ 1,760,175 ¥
(
48,941
)
-
2.7%
Asia
Thousands of units
Year ended March 31, 2012 vs. 2011 Change
2011 2012 Amount Percentage
Toyota
ʼ
s consolidated vehicle unit sales 1,255 1,327 72 +5.7%
Yen in millions
Year ended March 31, 2012 vs. 2011 Change
2011 2012 Amount Percentage
Net revenues:
Sales of products ¥3,325,466 ¥ 3,275,871 ¥
(
49,595
)
-
1.5%
Financial services 49,068 58,403 9,335 +19.0%
Total ¥3,374,534 ¥ 3,334,274 ¥
(
40,260
)
-
1.2%
0820
Search NextPrev page 56
Contents