Toyota 2012 Annual Report Download - page 105
Download and view the complete annual report
Please find page 105 of the 2012 Toyota annual report below. You can navigate through the pages in the report by either clicking on the pages listed below, or by using the keyword search tool below to find specific information within the annual report.-
 1
1 -
2
-
3
-
4
-
5
-
6
-
7
-
8
-
9
-
10
-
11
-
12
-
13
-
14
-
15
-
16
-
17
-
18
-
19
-
20
-
21
-
22
-
23
-
24
-
25
-
26
-
27
-
28
-
29
-
30
-
31
-
32
-
33
-
34
-
35
-
36
-
37
-
38
-
39
-
40
-
41
-
42
-
43
-
44
-
45
-
46
-
47
-
48
-
49
-
50
-
51
-
52
-
53
-
54
-
55
-
56
-
57
-
58
-
59
-
60
-
61
-
62
-
63
-
64
-
65
-
66
-
67
-
68
-
69
-
70
-
71
-
72
-
73
-
74
-
75
-
76
-
77
-
78
-
79
-
80
-
81
-
82
-
83
-
84
-
85
-
86
-
87
-
88
-
89
-
90
-
91
-
92
-
93
-
94
-
 95
95 -
 96
96 -
 97
97 -
 98
98 -
 99
99 -
 100
100 -
 101
101 -
 102
102 -
 103
103 -
 104
104 -
 105
105 -
 106
106 -
 107
107 -
 108
108 -
 109
109 -
 110
110 -
 111
111 -
 112
112 -
 113
113 -
 114
114 -
 115
115 -
116
-
117
-
118
-
119
-
120
-
121
-
122
-
123
-
124
-
125
-
126
-
127
 |
 |
TOYOTA ANNUAL REPORT 2012
Toyota Global Vision Changes for Making
Ever-Better Cars President
ʼ
s Message Medium- to Long-Term
Growth Initiatives Special Feature Management and
Corporate Information Investor Information
Business and
Performance Review Financial Section
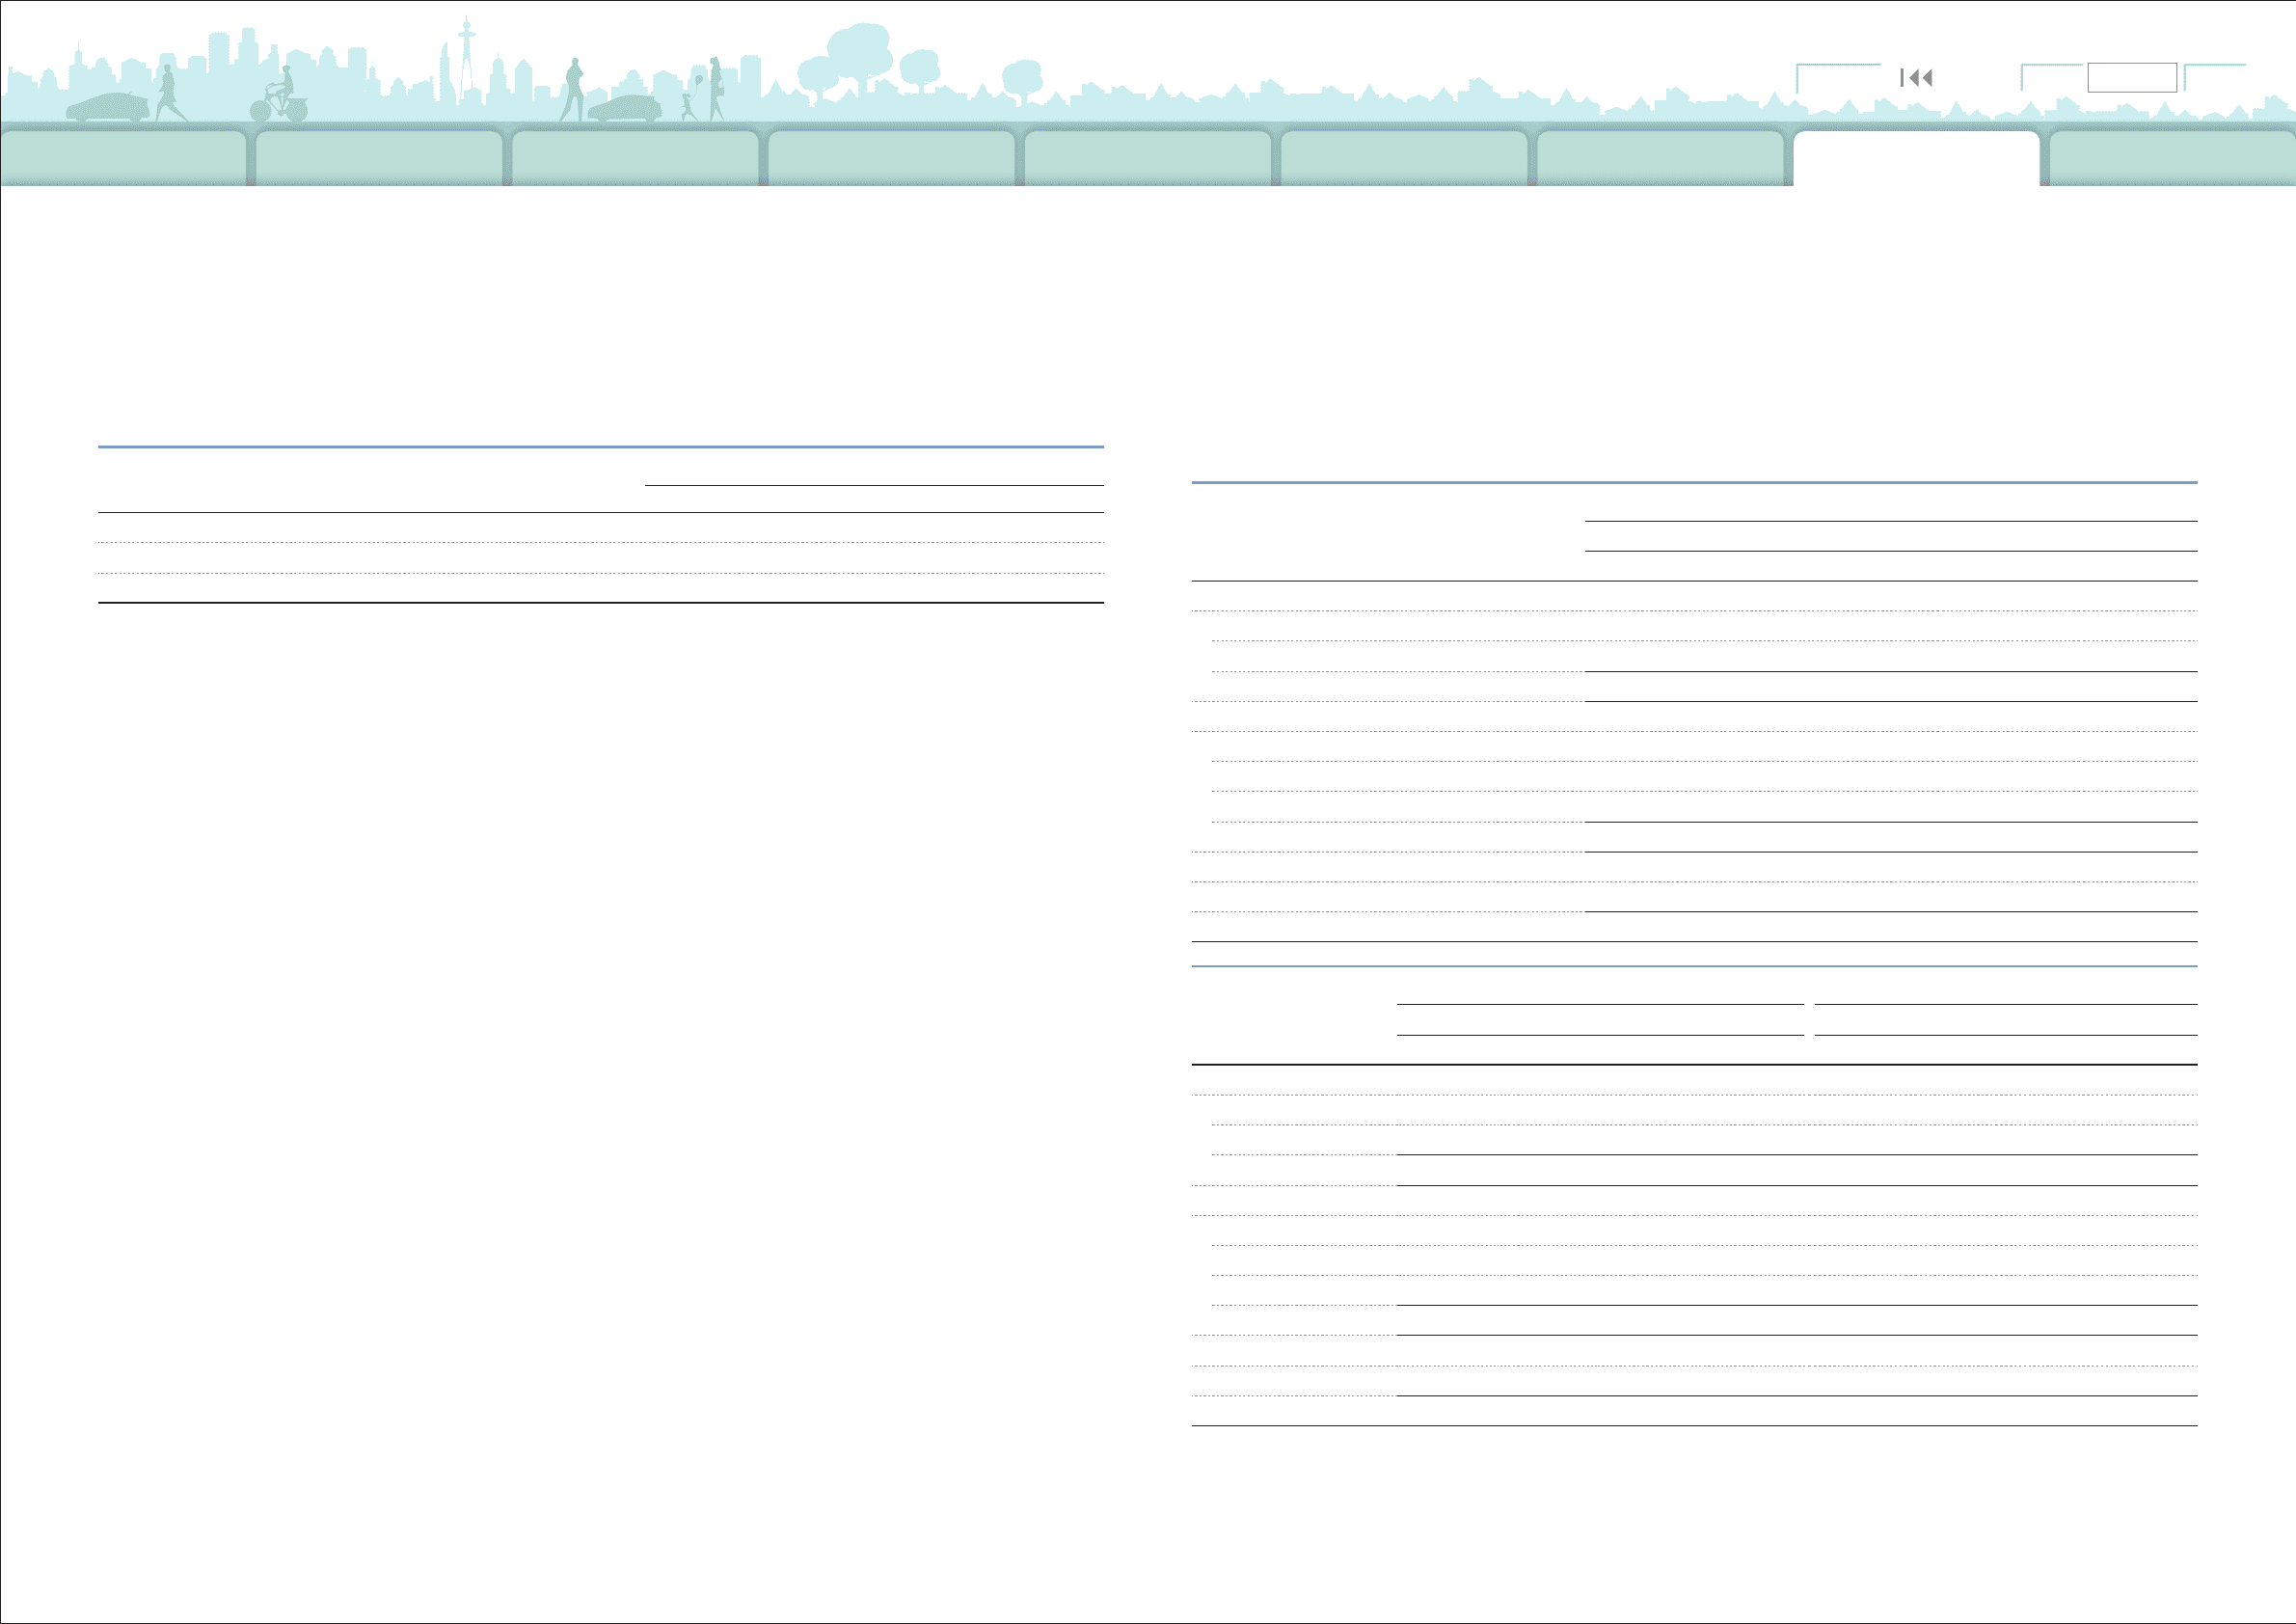
Notes to Consolidated Financial Statements
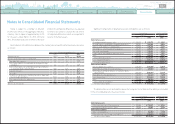
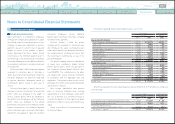
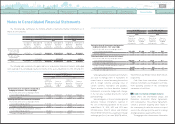
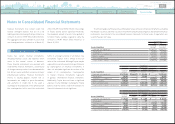
Weighted-average assumptions used to determine net periodic pension cost for the years ended
March 31, 2010, 2011 and 2012 are as follows:
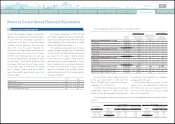
The following table summarizes the fair value of classes of plan assets as of March 31, 2011 and
2012. See note 26 to the consolidated financial statements for three levels of input which are used to
measure fair value.
For the years ended March 31,
2010 2011 2012
Discount rate 2.8% 2.8% 2.8%
Expected return on plan assets 3.6% 3.8% 3.9%
Rate of compensation increase 2.6% 2.6% 2.6%
During the years ended March 31, 2010,
2011 and 2012, the parent company and certain
subsidiaries in Japan employ
“
point
”
based
retirement benefit plans and do not use the
rates of compensation increase to determine net
periodic pension cost.
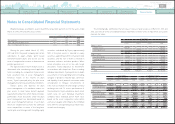
The expected rate of return on plan assets is
determined after considering several applicable
factors including, the composition of plan assets
held, assumed risks of asset management,
historical results of the returns on plan
assets, Toyota
ʼ
s principal policy for plan asset
management, and forecasted market conditions.
Toyota
ʼ
s policy and objective for plan
asset management is to maximize returns on
plan assets to meet future benefit payment
requirements under risks which Toyota considers
permissible. Asset allocations under the plan
asset management are determined based on
plan asset management policies of each plan
which are established to achieve the optimized
asset compositions in terms of the long-term
overall plan asset management. Excepting equity
securities contributed by Toyota, approximately
50% of the plan assets is invested in equity
securities, approximately 30% is invested in debt
securities, and the rest of them is invested in
insurance contracts and other products. When
actual allocations are not in line with target
allocations, Toyota rebalances its investments
in accordance with the policies. Prior to making
individual investments, Toyota performs in-depth
assessments of corresponding factors including
category of products, industry type, currencies
and liquidity of each potential investment under
consideration to mitigate concentrations of
risks such as market risk and foreign currency
exchange rate risk. To assess performance of
the investments, Toyota establishes bench mark
return rates for each individual investment,
combines these individual bench mark rates
based on the asset composition ratios within
each asset category, and compares the combined
rates with the corresponding actual return rates
on each asset category.
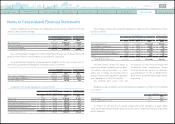
Yen in millions
March 31, 2011
Level 1 Level 2 Level 3 Total
Equity securities
Common stocks ¥ 489,759 ¥
—
¥
—
¥ 489,759
Commingled funds
—
180,901
—
180,901
489,759 180,901
—
670,660
Debt securities
Government bonds 82,685
—
—
82,685
Commingled funds
—
159,232
—
159,232
Other 29,217 44,994 746 74,957
111,902 204,226 746 316,874
Insurance contracts
—
90,972
—
90,972
Other 19,610 26,418 58,851 104,879
Total ¥621,271 ¥ 502,517 ¥ 59,597 ¥1,183,385
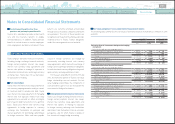
Yen in millions U.S. dollars in millions
March 31, 2012 March 31, 2012
Level 1 Level 2 Level 3 Total Level 1 Level 2 Level 3 Total
Equity securities
Common stocks ¥ 468,237 ¥
̶
¥
̶
¥ 468,237 $ 5,697 $
̶
$
̶
$ 5,697
Commingled funds
̶
232,842
̶
232,842
̶
2,833
̶
2,833
468,237 232,842
̶
701,079 5,697 2,833
̶
8,530
Debt securities
Government bonds 88,411
̶
̶
88,411 1,076
̶
̶
1,076
Commingled funds
̶
219,658
̶
219,658
̶
2,673
̶
2,673
Other
̶
49,433 591 50,024
̶
601 7 608
88,411 269,091 591 358,093 1,076 3,274 7 4,357
Insurance contracts
̶
83,993
̶
83,993
̶
1,022
̶
1,022
Other 48,190 7,974 71,442 127,606 586 97 869 1,552
Total ¥ 604,838 ¥ 593,900 ¥ 72,033 ¥ 1,270,771 $ 7,359 $ 7,226 $ 876 $ 15,461
0820
Search NextPrev page 105
Contents