Toyota 2012 Annual Report Download - page 90
Download and view the complete annual report
Please find page 90 of the 2012 Toyota annual report below. You can navigate through the pages in the report by either clicking on the pages listed below, or by using the keyword search tool below to find specific information within the annual report.-
 1
1 -
2
-
3
-
4
-
5
-
6
-
7
-
8
-
9
-
10
-
11
-
12
-
13
-
14
-
15
-
16
-
17
-
18
-
19
-
20
-
21
-
22
-
23
-
24
-
25
-
26
-
27
-
28
-
29
-
30
-
31
-
32
-
33
-
34
-
35
-
36
-
37
-
38
-
39
-
40
-
41
-
42
-
43
-
44
-
45
-
46
-
47
-
48
-
49
-
50
-
51
-
52
-
53
-
54
-
55
-
56
-
57
-
58
-
59
-
60
-
61
-
62
-
63
-
64
-
65
-
66
-
67
-
68
-
69
-
70
-
71
-
72
-
73
-
74
-
75
-
76
-
77
-
78
-
79
-
 80
80 -
 81
81 -
 82
82 -
 83
83 -
 84
84 -
 85
85 -
 86
86 -
 87
87 -
 88
88 -
 89
89 -
 90
90 -
 91
91 -
 92
92 -
 93
93 -
 94
94 -
 95
95 -
 96
96 -
 97
97 -
 98
98 -
 99
99 -
 100
100 -
101
-
102
-
103
-
104
-
105
-
106
-
107
-
108
-
109
-
110
-
111
-
112
-
113
-
114
-
115
-
116
-
117
-
118
-
119
-
120
-
121
-
122
-
123
-
124
-
125
-
126
-
127
 |
 |

TOYOTA ANNUAL REPORT 2012
Toyota Global Vision Changes for Making
Ever-Better Cars President
ʼ
s Message Medium- to Long-Term
Growth Initiatives Special Feature Management and
Corporate Information Investor Information
Business and
Performance Review Financial Section
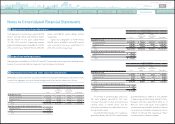
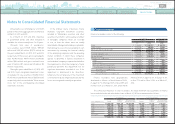
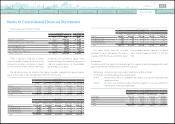
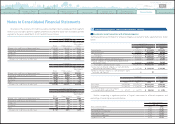
Notes to Consolidated Financial Statements
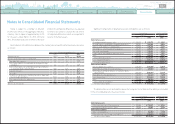
Finance leases consist of the following:
Yen in millions
U.S. dollars in millions
March 31, March 31,
2011 2012 2012
Minimum lease payments ¥ 804,871 ¥ 688,642 $ 8,379
Estimated unguaranteed residual values 318,317 266,788 3,246
1,123,188 955,430 11,625
Deferred origination costs 5,406 3,722 45
Less - Unearned income
(
104,419
)(
90,887
) (
1,106
)
Less - Allowance for credit losses
(
36,024
)(
30,637
) (
373
)
Finance leases, net ¥ 988,151 ¥ 837,628 $10,191
or otherwise fail to perform as agreed. Toyota
estimates allowance for credit losses by variety of
credit-risk evaluation process to cover probable
and estimable losses above.
loan receivables portfolio segment in the United
States and other regions as of March 31, 2011 and
2012:
Toyota is exposed to credit risk on Toyota
ʼ
s
finance receivables. Credit risk is the risk of loss
arising from the failure of customers or dealers
to meet the terms of their contracts with Toyota
The tables below show the recorded
investment for each credit quality of the finance
receivable within the wholesale and other dealer
The wholesale and other dealer loan receivables portfolio segment is primarily segregated into credit
qualities below based on internal risk assessments by dealers.
Performing: Account not classified as either Credit Watch, At Risk or Default
Credit Watch: Account designated for elevated attention
At Risk: Account where there is a probability that default exists based on qualitative and
quantitative factors
Default: Account is not currently meeting contractual obligations or we have temporarily
waived certain contractual requirements
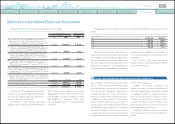
The table below shows the amount of the finance receivables segregated into aging categories
based on the number of days outstanding as of March 31, 2011 and 2012:
Yen in millions
March 31, 2011
Retail Finance leases Wholesale Real estate Working capital
Current ¥ 7,017,171 ¥1,111,453 ¥ 897,971 ¥ 494,700 ¥ 593,516
31-60 days past due 72,082 5,968 2,260 404 44
61-90 days past due 15,466 1,283 355 34 0
Over 90 days past due 23,734 4,484 74 621 578
Total ¥ 7,128,453 ¥ 1,123,188 ¥ 900,660 ¥ 495,759 ¥ 594,138
Yen in millions
March 31, 2011
Wholesale Real estate Working capital Total
Performing ¥504,960 ¥283,450 ¥ 90,545 ¥ 878,955
Credit Watch 58,106 41,967 12,198 112,271
At Risk 6,494 12,344 1,066 19,904
Default 803 931 655 2,389
Total ¥570,363 ¥338,692 ¥104,464 ¥1,013,519
Yen in millions
March 31, 2012
Retail Finance leases Wholesale Real estate Working capital
Current ¥ 7,146,365 ¥ 939,345 ¥ 923,642 ¥ 535,296 ¥ 574,671
31-60 days past due 64,314 5,766 3
̶
70
61-90 days past due 13,851 2,645
̶
̶
̶
Over 90 days past due 24,263 7,674 53 98 121
Total ¥ 7,248,793 ¥ 955,430 ¥ 923,698 ¥ 535,394 ¥ 574,862
U.S. dollars in millions
March 31, 2012
Retail Finance leases Wholesale Real estate Working capital
Current $ 86,949 $ 11,429 $ 11,238 $ 6,513 $ 6,992
31-60 days past due 782 70 0
̶
1
61-90 days past due 169 32
̶
̶
̶
Over 90 days past due 295 94 1 1 1
Total $ 88,195 $ 11,625 $ 11,239 $ 6,514 $ 6,994
United States
0820
Search NextPrev page 90
Contents