Toyota 2012 Annual Report Download - page 60
Download and view the complete annual report
Please find page 60 of the 2012 Toyota annual report below. You can navigate through the pages in the report by either clicking on the pages listed below, or by using the keyword search tool below to find specific information within the annual report.-
 1
1 -
2
-
3
-
4
-
5
-
6
-
7
-
8
-
9
-
10
-
11
-
12
-
13
-
14
-
15
-
16
-
17
-
18
-
19
-
20
-
21
-
22
-
23
-
24
-
25
-
26
-
27
-
28
-
29
-
30
-
31
-
32
-
33
-
34
-
35
-
36
-
37
-
38
-
39
-
40
-
41
-
42
-
43
-
44
-
45
-
46
-
47
-
48
-
49
-
 50
50 -
 51
51 -
 52
52 -
 53
53 -
 54
54 -
 55
55 -
 56
56 -
 57
57 -
 58
58 -
 59
59 -
 60
60 -
 61
61 -
 62
62 -
 63
63 -
 64
64 -
 65
65 -
 66
66 -
 67
67 -
 68
68 -
 69
69 -
 70
70 -
71
-
72
-
73
-
74
-
75
-
76
-
77
-
78
-
79
-
80
-
81
-
82
-
83
-
84
-
85
-
86
-
87
-
88
-
89
-
90
-
91
-
92
-
93
-
94
-
95
-
96
-
97
-
98
-
99
-
100
-
101
-
102
-
103
-
104
-
105
-
106
-
107
-
108
-
109
-
110
-
111
-
112
-
113
-
114
-
115
-
116
-
117
-
118
-
119
-
120
-
121
-
122
-
123
-
124
-
125
-
126
-
127
 |
 |
TOYOTA ANNUAL REPORT 2012
Toyota Global Vision Changes for Making
Ever-Better Cars President
ʼ
s Message Medium- to Long-Term
Growth Initiatives Special Feature Management and
Corporate Information Investor Information
Business and
Performance Review Financial Section
Management's Discussion and Analysis of Financial Condition and Results of Operations
fiscal 2012 compared with the prior fiscal year to
¥21.6 billion. This decrease in operating income
was due to the ¥250.0 billion unfavorable impact
of fluctuations in foreign currency rates and the
¥100.0 billion increase in miscellaneous costs
and others, partially offset by the ¥170.0 billion
effect of cost reduction efforts, and the ¥150.0
billion of favorable impact by changes in vehicle
unit sales and sales mix.
The changes in vehicle unit sales and changes
in sales mix was due primarily to an increase in
Toyota
ʼ
s vehicle unit sales by 44 thousand vehicles
compared with the prior fiscal year resulting from
the introduction of new products in spite of the
impact of the Great East Japan Earthquake and the
flood in Thailand. The increase in miscellaneous
costs and others was due primarily to the ¥100.0
billion increase in labor costs and the ¥50.0 billion
increase in research and development expenses.
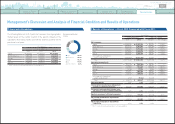
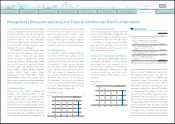
Ratio of credit loss experience in the United States is as follows:
Net revenues for Toyota
ʼ
s other operations
segments increased by ¥76.6 billion, or 7.9%, to
¥1,048.9 billion during fiscal 2012 compared with
the prior fiscal year.
Operating income from Toyota
ʼ
s other
operations segments increased by ¥6.8 billion,
or 19.4%, to ¥42.0 billion during fiscal 2012
compared with the prior fiscal year.
Net revenues for the financial services operations
decreased during fiscal 2012 by ¥91.8 billion,
or 7.7%, compared with the prior fiscal year to
¥1,100.3 billion. This decrease was primarily
due to the unfavorable impact of fluctuations in
foreign currency translation rates and others
of ¥66.9 billion and the ¥18.3 billion decrease in
rental income from vehicles and equipment on
operating leases.
Operating income from financial services
operations decreased by ¥51.8 billion, or 14.5%,
to ¥306.4 billion during fiscal 2012 compared
with the prior fiscal year. This decrease was
due primarily to the recording of ¥20.8 billion of
valuation losses on interest rate swaps stated at
fair value.
Financial Services Operations Segment
Year ended March 31,
2011 2012
Net charge-offs as a percentage of average gross earning assets:
Finance receivables 0.61% 0.24%
Operating lease 0.22% 0.11%
Total 0.52% 0.21%
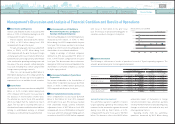
All Other Operations Segment
Results of Operations
̶
Fiscal 2011 Compared with Fiscal 2010
*
“
Other
”
consists of Central and South America, Oceania and Africa.
Yen in millions
Year ended March 31, 2011 vs. 2010 Change
2010 2011 Amount Percentage
Net revenues:
Japan ¥ 11,220,303 ¥10,986,246 ¥
(
234,057
)
-
2.1%
North America 5,670,526 5,429,136
(
241,390
)
-
4.3%
Europe 2,147,049 1,981,497
(
165,552
)
-
7.7%
Asia 2,655,327 3,374,534 719,207 +27.1%
Other* 1,673,861 1,809,116 135,255 +8.1%
Intersegment elimination/unallocated amount
(
4,416,093
)(
4,586,841
)(
170,748
)—
Total ¥ 18,950,973 ¥18,993,688 ¥ 42,715 +0.2%
Operating income
(
loss
)
:
Japan ¥
(
225,242
)
¥
(
362,396
)
¥
(
137,154
)—
North America 85,490 339,503 254,013 +297.1%
Europe
(
32,955
)
13,148 46,103
—
Asia 203,527 312,977 109,450 +53.8%
Other* 115,574 160,129 44,555 +38.6%
Intersegment elimination/unallocated amount 1,122 4,918 3,796 +338.3%
Total ¥ 147,516 ¥ 468,279 ¥ 320,763 +217.4%
Operating margin
0.8% 2.5% 1.7%
Income before income taxes and equity in
earnings of affiliated companies 291,468 563,290 271,822 +93.3%
Net margin from income before income taxes and
equity in earnings of affiliated companies
1.5% 3.0% 1.5%
Equity in earnings of affiliated companies 45,408 215,016 169,608 +373.5%
Net income attributable to Toyota Motor
Corporation 209,456 408,183 198,727 +94.9%
Net margin attributable to Toyota Motor
Corporation 1.1% 2.1% 1.0%
0820
Search NextPrev page 60
Contents