Toyota 2012 Annual Report Download - page 98
Download and view the complete annual report
Please find page 98 of the 2012 Toyota annual report below. You can navigate through the pages in the report by either clicking on the pages listed below, or by using the keyword search tool below to find specific information within the annual report.-
 1
1 -
2
-
3
-
4
-
5
-
6
-
7
-
8
-
9
-
10
-
11
-
12
-
13
-
14
-
15
-
16
-
17
-
18
-
19
-
20
-
21
-
22
-
23
-
24
-
25
-
26
-
27
-
28
-
29
-
30
-
31
-
32
-
33
-
34
-
35
-
36
-
37
-
38
-
39
-
40
-
41
-
42
-
43
-
44
-
45
-
46
-
47
-
48
-
49
-
50
-
51
-
52
-
53
-
54
-
55
-
56
-
57
-
58
-
59
-
60
-
61
-
62
-
63
-
64
-
65
-
66
-
67
-
68
-
69
-
70
-
71
-
72
-
73
-
74
-
75
-
76
-
77
-
78
-
79
-
80
-
81
-
82
-
83
-
84
-
85
-
86
-
87
-
 88
88 -
 89
89 -
 90
90 -
 91
91 -
 92
92 -
 93
93 -
 94
94 -
 95
95 -
 96
96 -
 97
97 -
 98
98 -
 99
99 -
 100
100 -
 101
101 -
 102
102 -
 103
103 -
 104
104 -
 105
105 -
 106
106 -
 107
107 -
 108
108 -
109
-
110
-
111
-
112
-
113
-
114
-
115
-
116
-
117
-
118
-
119
-
120
-
121
-
122
-
123
-
124
-
125
-
126
-
127
 |
 |
TOYOTA ANNUAL REPORT 2012
Toyota Global Vision Changes for Making
Ever-Better Cars President
ʼ
s Message Medium- to Long-Term
Growth Initiatives Special Feature Management and
Corporate Information Investor Information
Business and
Performance Review Financial Section
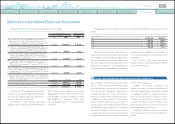
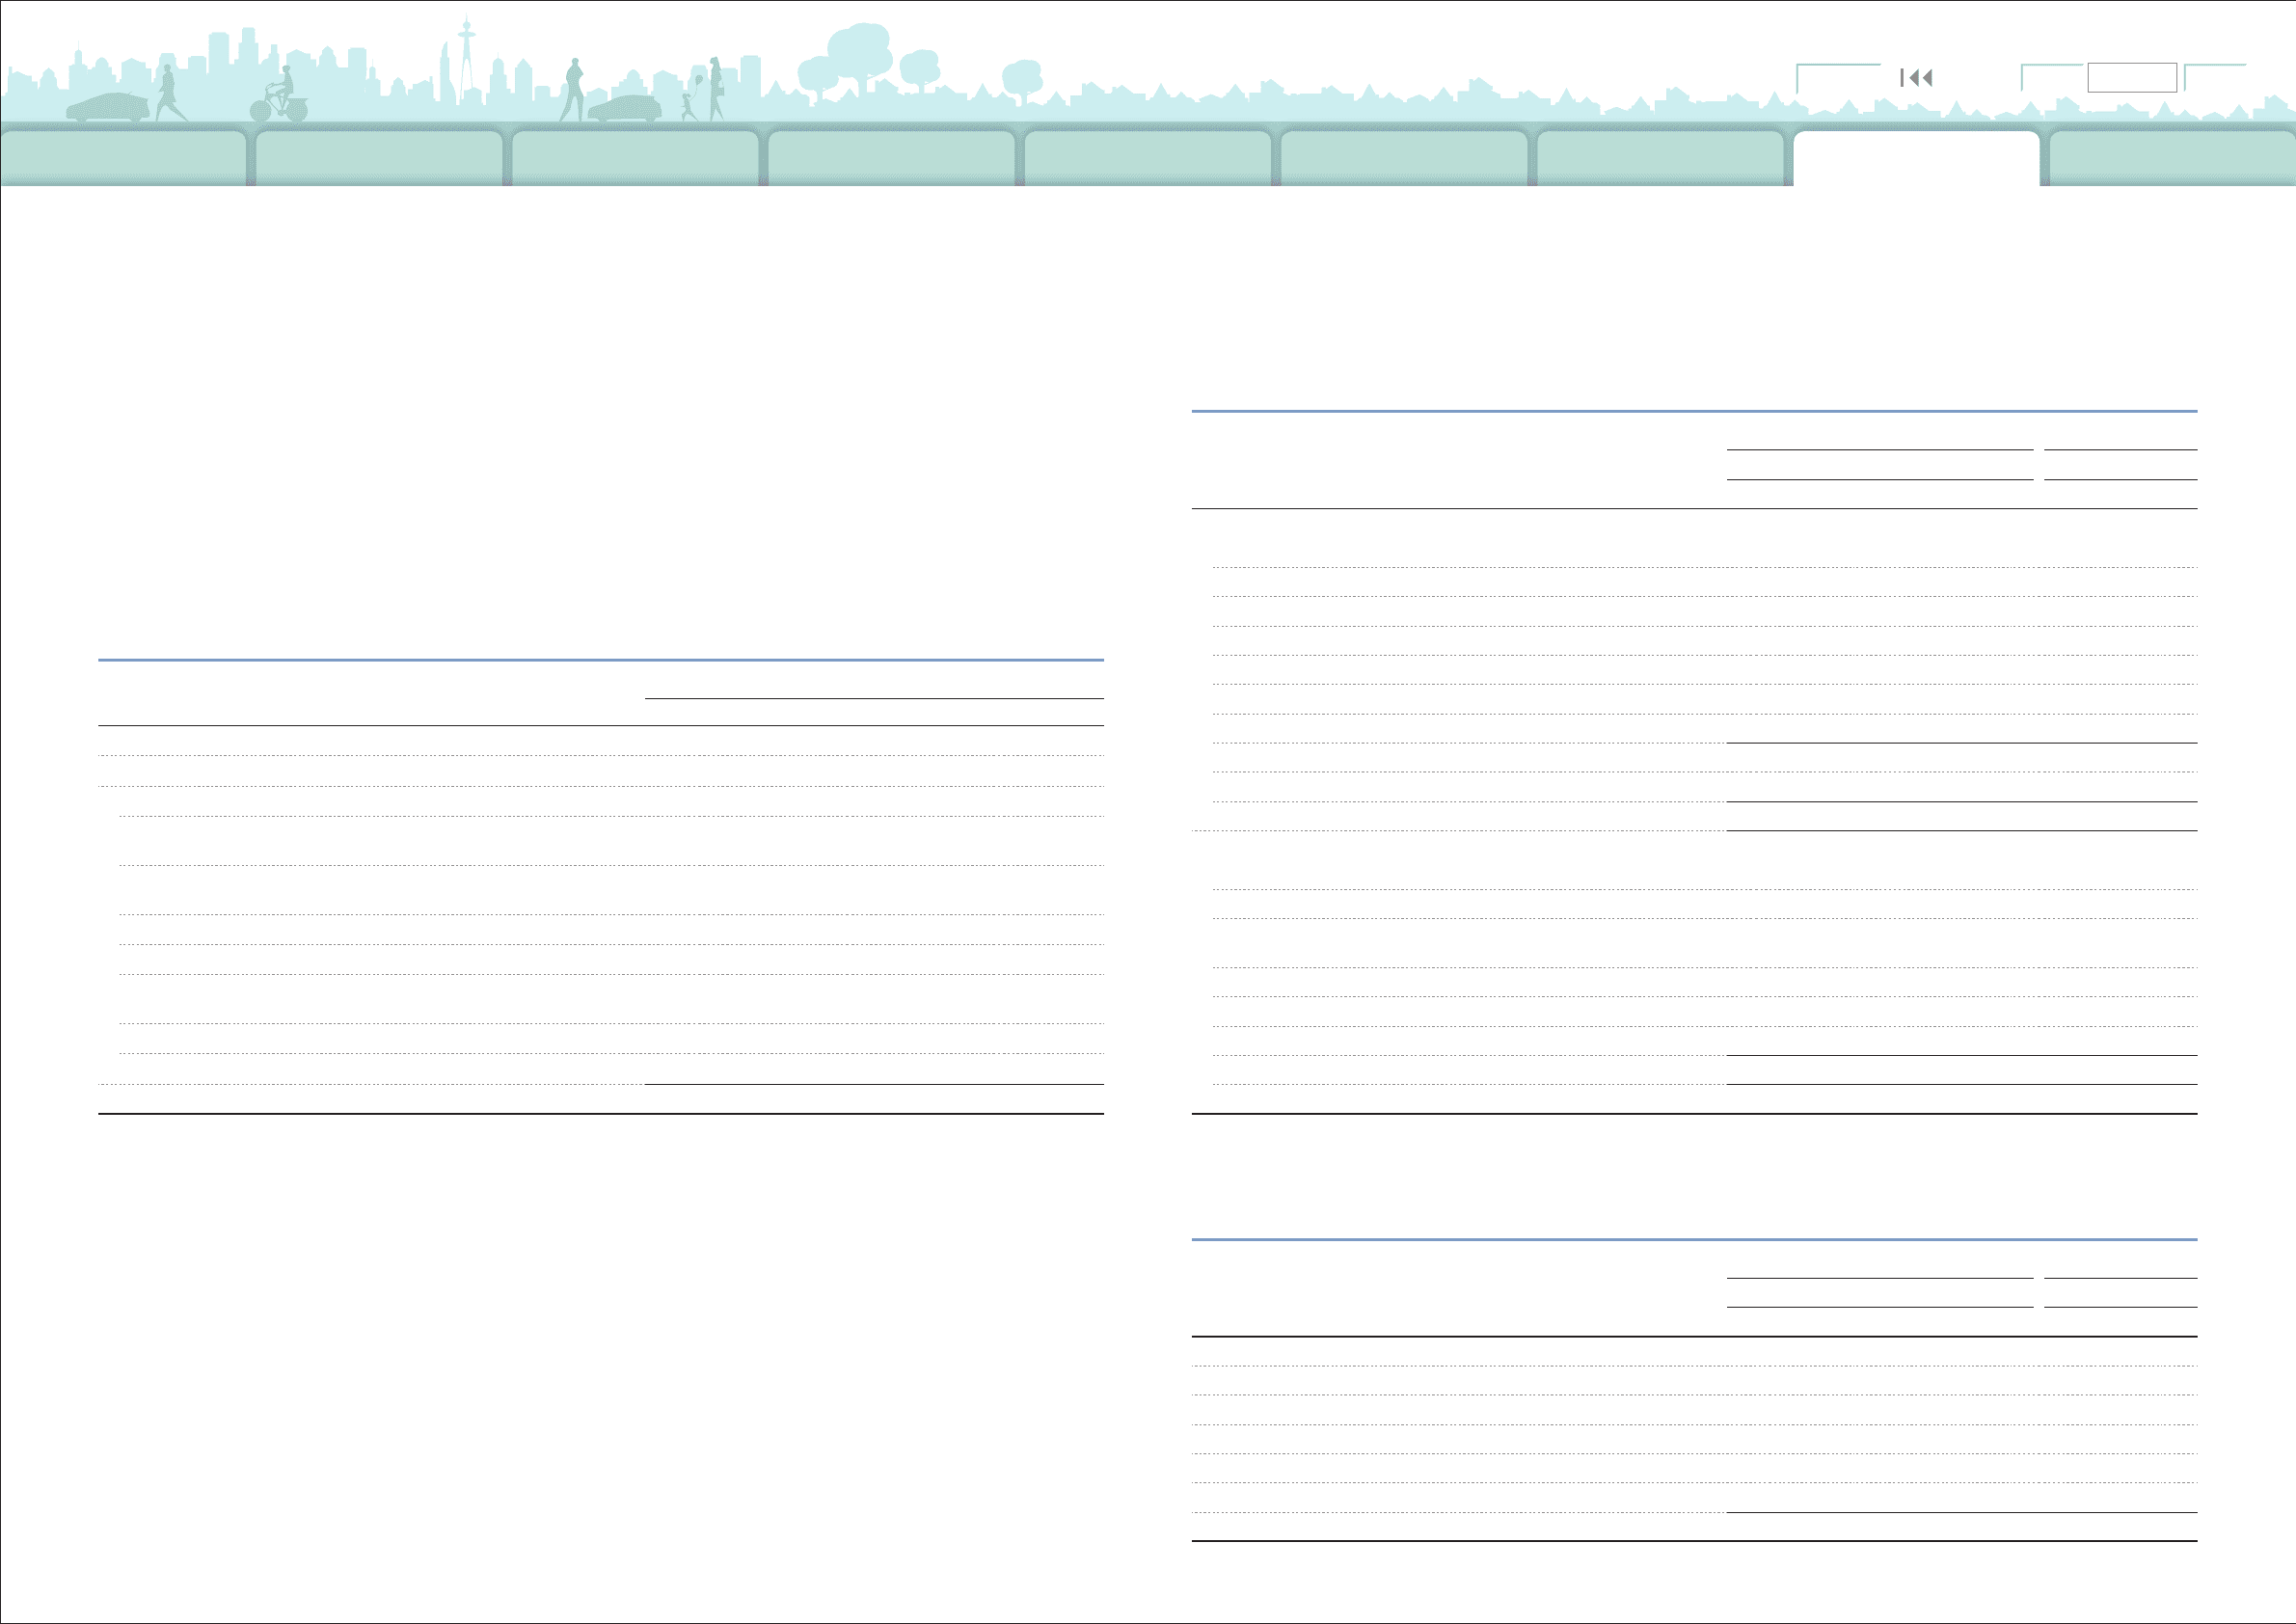
Notes to Consolidated Financial Statements
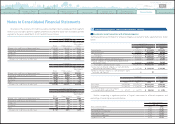
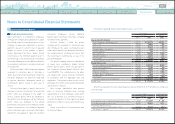
Reconciliation of the differences between the statutory tax rate and the effective income tax rate is
as follows:
Toyota is subject to a number of different
income taxes which, in the aggregate, indicate a
statutory rate in Japan of approximately 40.2%
for the years ended March 31, 2010, 2011 and
2012. The statutory tax rates in effect for the year
in which the temporary differences are expected
to reverse are used to calculate the tax effects
of temporary differences which are expected to
reverse in the future years.
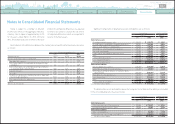
For the years ended March 31,
2010 2011 2012
Statutory tax rate 40.2% 40.2% 40.2%
Increase
(
reduction
)
in taxes resulting from:
Non-deductible expenses 1.9 2.2 1.7
Deferred tax liabilities on undistributed earnings of foreign
subsidiaries 4.4 4.8 4.7
Deferred tax liabilities on undistributed earnings of affiliates
accounted for by the equity method
(
0.6
)
12.6 9.2
Valuation allowance 11.2 8.1 14.9
Tax credits
(
11.8
) (
2.6
)(
1.8
)
The difference between the statutory tax rate in Japan and
that of foreign subsidiaries
(
10.7
) (
9.3
)(
9.6
)
Unrecognized tax benefits adjustments 2.3
(
0.6
)
2.5
Other
(
5.1
)
0.1
(
1.2
)
Effective income tax rate 31.8% 55.5% 60.6%
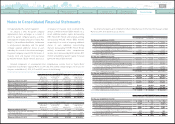
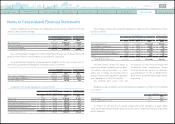
Significant components of deferred tax assets and liabilities are as follows:
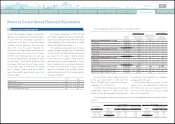
The deferred tax assets and liabilities above that comprise the net deferred tax liability are included
in the consolidated balance sheets as follows:
Yen in millions
U.S. dollars in millions
March 31, March 31,
2011 2012 2012
Deferred tax assets
Deferred income taxes
(
Current assets
)
¥ 605,884 ¥ 718,687 $ 8,744
Investments and other assets - Other 118,849 91,857 1,118
Deferred tax liabilities
Other current liabilities
(
14,919
)(
14,953
) (
182
)
Deferred income taxes
(
Long-term liabilities
) (
810,127
)(
908,883
) (
11,058
)
Net deferred tax liability ¥
(
100,313
)
¥
(
113,292
)
$
(
1,378
)
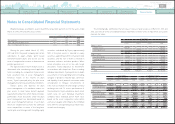
Yen in millions
U.S. dollars in millions
March 31, March 31,
2011 2012 2012
Deferred tax assets
Accrued pension and severance costs
¥ 226,093 ¥ 236,978 $ 2,883
Accrued expenses and liabilities for quality assurances 395,513 369,985 4,502
Other accrued employees
ʼ
compensation 103,020 106,265 1,293
Operating loss carryforwards for tax purposes 296,731 337,992 4,112
Tax credit carryforwards 127,289 108,426 1,319
Property, plant and equipment and other assets 176,229 147,906 1,800
Other 277,449 296,934 3,613
Gross deferred tax assets 1,602,324 1,604,486 19,522
Less - Valuation allowance
(
280,685
)(
309,268
) (
3,763
)
Total deferred tax assets ¥ 1,321,639 ¥ 1,295,218 $ 15,759
Deferred tax liabilities
Unrealized gains on securities
(
146,874
)(
210,475
) (
2,561
)
Undistributed earnings of foreign subsidiaries
(
26,783
)(
27,581
) (
336
)
Undistributed earnings of affiliates accounted for by the
equity method
(
578,756
)(
504,776
) (
6,141
)
Basis difference of acquired assets
(
38,351
)(
34,120
) (
415
)
Lease transactions
(
556,349
)(
576,809
) (
7,018
)
Other
(
74,839
)(
54,749
) (
666
)
Gross deferred tax liabilities
(
1,421,952
)(
1,408,510
) (
17,137
)
Net deferred tax liability ¥
(
100,313
)
¥
(
113,292
)
$
(
1,378
)
0820
Search NextPrev page 98
Contents