Toyota 2012 Annual Report Download - page 69
Download and view the complete annual report
Please find page 69 of the 2012 Toyota annual report below. You can navigate through the pages in the report by either clicking on the pages listed below, or by using the keyword search tool below to find specific information within the annual report.-
 1
1 -
2
-
3
-
4
-
5
-
6
-
7
-
8
-
9
-
10
-
11
-
12
-
13
-
14
-
15
-
16
-
17
-
18
-
19
-
20
-
21
-
22
-
23
-
24
-
25
-
26
-
27
-
28
-
29
-
30
-
31
-
32
-
33
-
34
-
35
-
36
-
37
-
38
-
39
-
40
-
41
-
42
-
43
-
44
-
45
-
46
-
47
-
48
-
49
-
50
-
51
-
52
-
53
-
54
-
55
-
56
-
57
-
58
-
 59
59 -
 60
60 -
 61
61 -
 62
62 -
 63
63 -
 64
64 -
 65
65 -
 66
66 -
 67
67 -
 68
68 -
 69
69 -
 70
70 -
 71
71 -
 72
72 -
 73
73 -
 74
74 -
 75
75 -
 76
76 -
 77
77 -
 78
78 -
 79
79 -
80
-
81
-
82
-
83
-
84
-
85
-
86
-
87
-
88
-
89
-
90
-
91
-
92
-
93
-
94
-
95
-
96
-
97
-
98
-
99
-
100
-
101
-
102
-
103
-
104
-
105
-
106
-
107
-
108
-
109
-
110
-
111
-
112
-
113
-
114
-
115
-
116
-
117
-
118
-
119
-
120
-
121
-
122
-
123
-
124
-
125
-
126
-
127
 |
 |
TOYOTA ANNUAL REPORT 2012
Toyota Global Vision Changes for Making
Ever-Better Cars President
ʼ
s Message Medium- to Long-Term
Growth Initiatives Special Feature Management and
Corporate Information Investor Information
Business and
Performance Review Financial Section
Management's Discussion and Analysis of Financial Condition and Results of Operations
¥1,442.6 billion for fiscal 2012, compared with
¥2,116.3 billion for the prior fiscal year. The
decrease in net cash used in investing activities
resulted from a decrease in purchases of
marketable securities and security investments,
partially offset by a decrease in sales and
maturity of marketable securities and security
investments.
Net cash provided by or used in financing
activities was a ¥355.3 billion decrease for fiscal
2012, compared with a ¥434.3 billion increase
for the prior fiscal year. The decrease in net
cash provided by or used in financing activities
resulted from decreased proceeds from issuance
of long-term debt and increased payments of
long-term debt.
Total capital expenditures for property, plant
and equipment, excluding vehicles and equipment
on operating leases, were ¥723.5 billion during
fiscal 2012, an increase of 15.0% over the ¥629.3
current and future environment regulations as
described in
“
Information on the Company
—
Business Overview
—
Governmental Regulation,
Environmental and Safety Standards
”
in Toyota
ʼ
s
annual report on Form 20-F.
Cash and cash equivalents were ¥1,679.2
billion as of March 31, 2012. Most of Toyota
ʼ
s cash
and cash equivalents are held in Japanese yen
and in U.S. dollars. In addition, time deposits
were ¥80.3 billion and marketable securities
were ¥1,181.0 billion as of March 31, 2012.
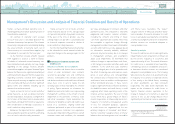
Liquid assets, which Toyota defines as cash
and cash equivalents, time deposits, marketable
debt securities and its investment in monetary
trust funds, decreased during fiscal 2012 by
¥201.7 billion, or 3.4%, to ¥5,761.4 billion.
Trade accounts and notes receivable, less
allowance for doubtful accounts increased during
fiscal 2012 by ¥550.6 billion, or 38.0%, to ¥1,999.8
billion. This increase was due to an increase in
the volume of sales in fiscal 2012.
Inventories increased during fiscal 2012
by ¥318.0 billion, or 24.4%, to ¥1,622.2 billion.
This increase was due to an increase in trading
volume.
Total finance receivables, net increased
during fiscal 2012 by ¥23.8 billion, or 0.2%, to
¥9,717.3 billion. This increase was due to an
increase in the number of financing contracts,
partially offset by fluctuations in foreign currency
translation rates. As of March 31, 2012, finance
receivables were geographically distributed as
follows: in North America 58.1%, in Japan 12.0%,
billion in total capital expenditures during the
prior fiscal year. This increase was due to an
increase of investments in Asia.
Total capital expenditures for vehicles and
equipment on operating leases were ¥808.5
billion during fiscal 2012, a decrease of 23.9%
over the ¥1,061.8 billion in expenditures from
the prior fiscal year. This decrease was due to a
decrease in investments in the financial services
operations.
Toyota expects investments in property, plant
and equipment, excluding vehicles and equipment
on operating leases, to be approximately ¥820.0
billion during fiscal 2013.
Based on current available information,
Toyota does not expect environmental matters
to have a material impact on its financial
position, results of operations, liquidity or cash
flows during fiscal 2013. However, uncertainty
exists with respect to Toyota
ʼ
s obligations under
in Europe 10.3%, in Asia 7.1% and in Other 12.5%.
Marketable securities and other securities
investments, including those included in current
assets, increased during fiscal 2012 by ¥438.0
billion, or 9.1%, reflecting purchase of marketable
securities and security investments, and an
increase in the fair values of common stocks.
Property, plant and equipment decreased
during fiscal 2012 by ¥73.7 billion, or 1.2%,
primarily reflecting the impacts of depreciation
charges during the year and fluctuations in
foreign currency translation rates, partially offset
by the capital expenditures.
Accounts and notes payable increased
during fiscal 2012 by ¥739.5 billion, or 49.2%. This
increase was due to an increase in production
volume in fiscal 2012.
Accrued expenses increased during fiscal
2012 by ¥55.2 billion, or 3.1%.
Income taxes payable increased during fiscal
2012 by ¥20.9 billion, or 18.6%, as a result of an
increase of income taxes payable at automotive
operations.
Toyota
ʼ
s total borrowings decreased during
fiscal 2012 by ¥395.5 billion, or 3.2%. Toyota
ʼ
s
short-term borrowings consist of loans with
a weighted-average interest rate of 1.93% and
commercial paper with a weighted-average
interest rate of 0.72%. Short-term borrowings
increased during fiscal 2012 by ¥271.6 billion,
or 8.5%, to ¥3,450.6 billion. Toyota
ʼ
s long-term
debt consists of unsecured and secured loans,
medium-term notes, unsecured notes and
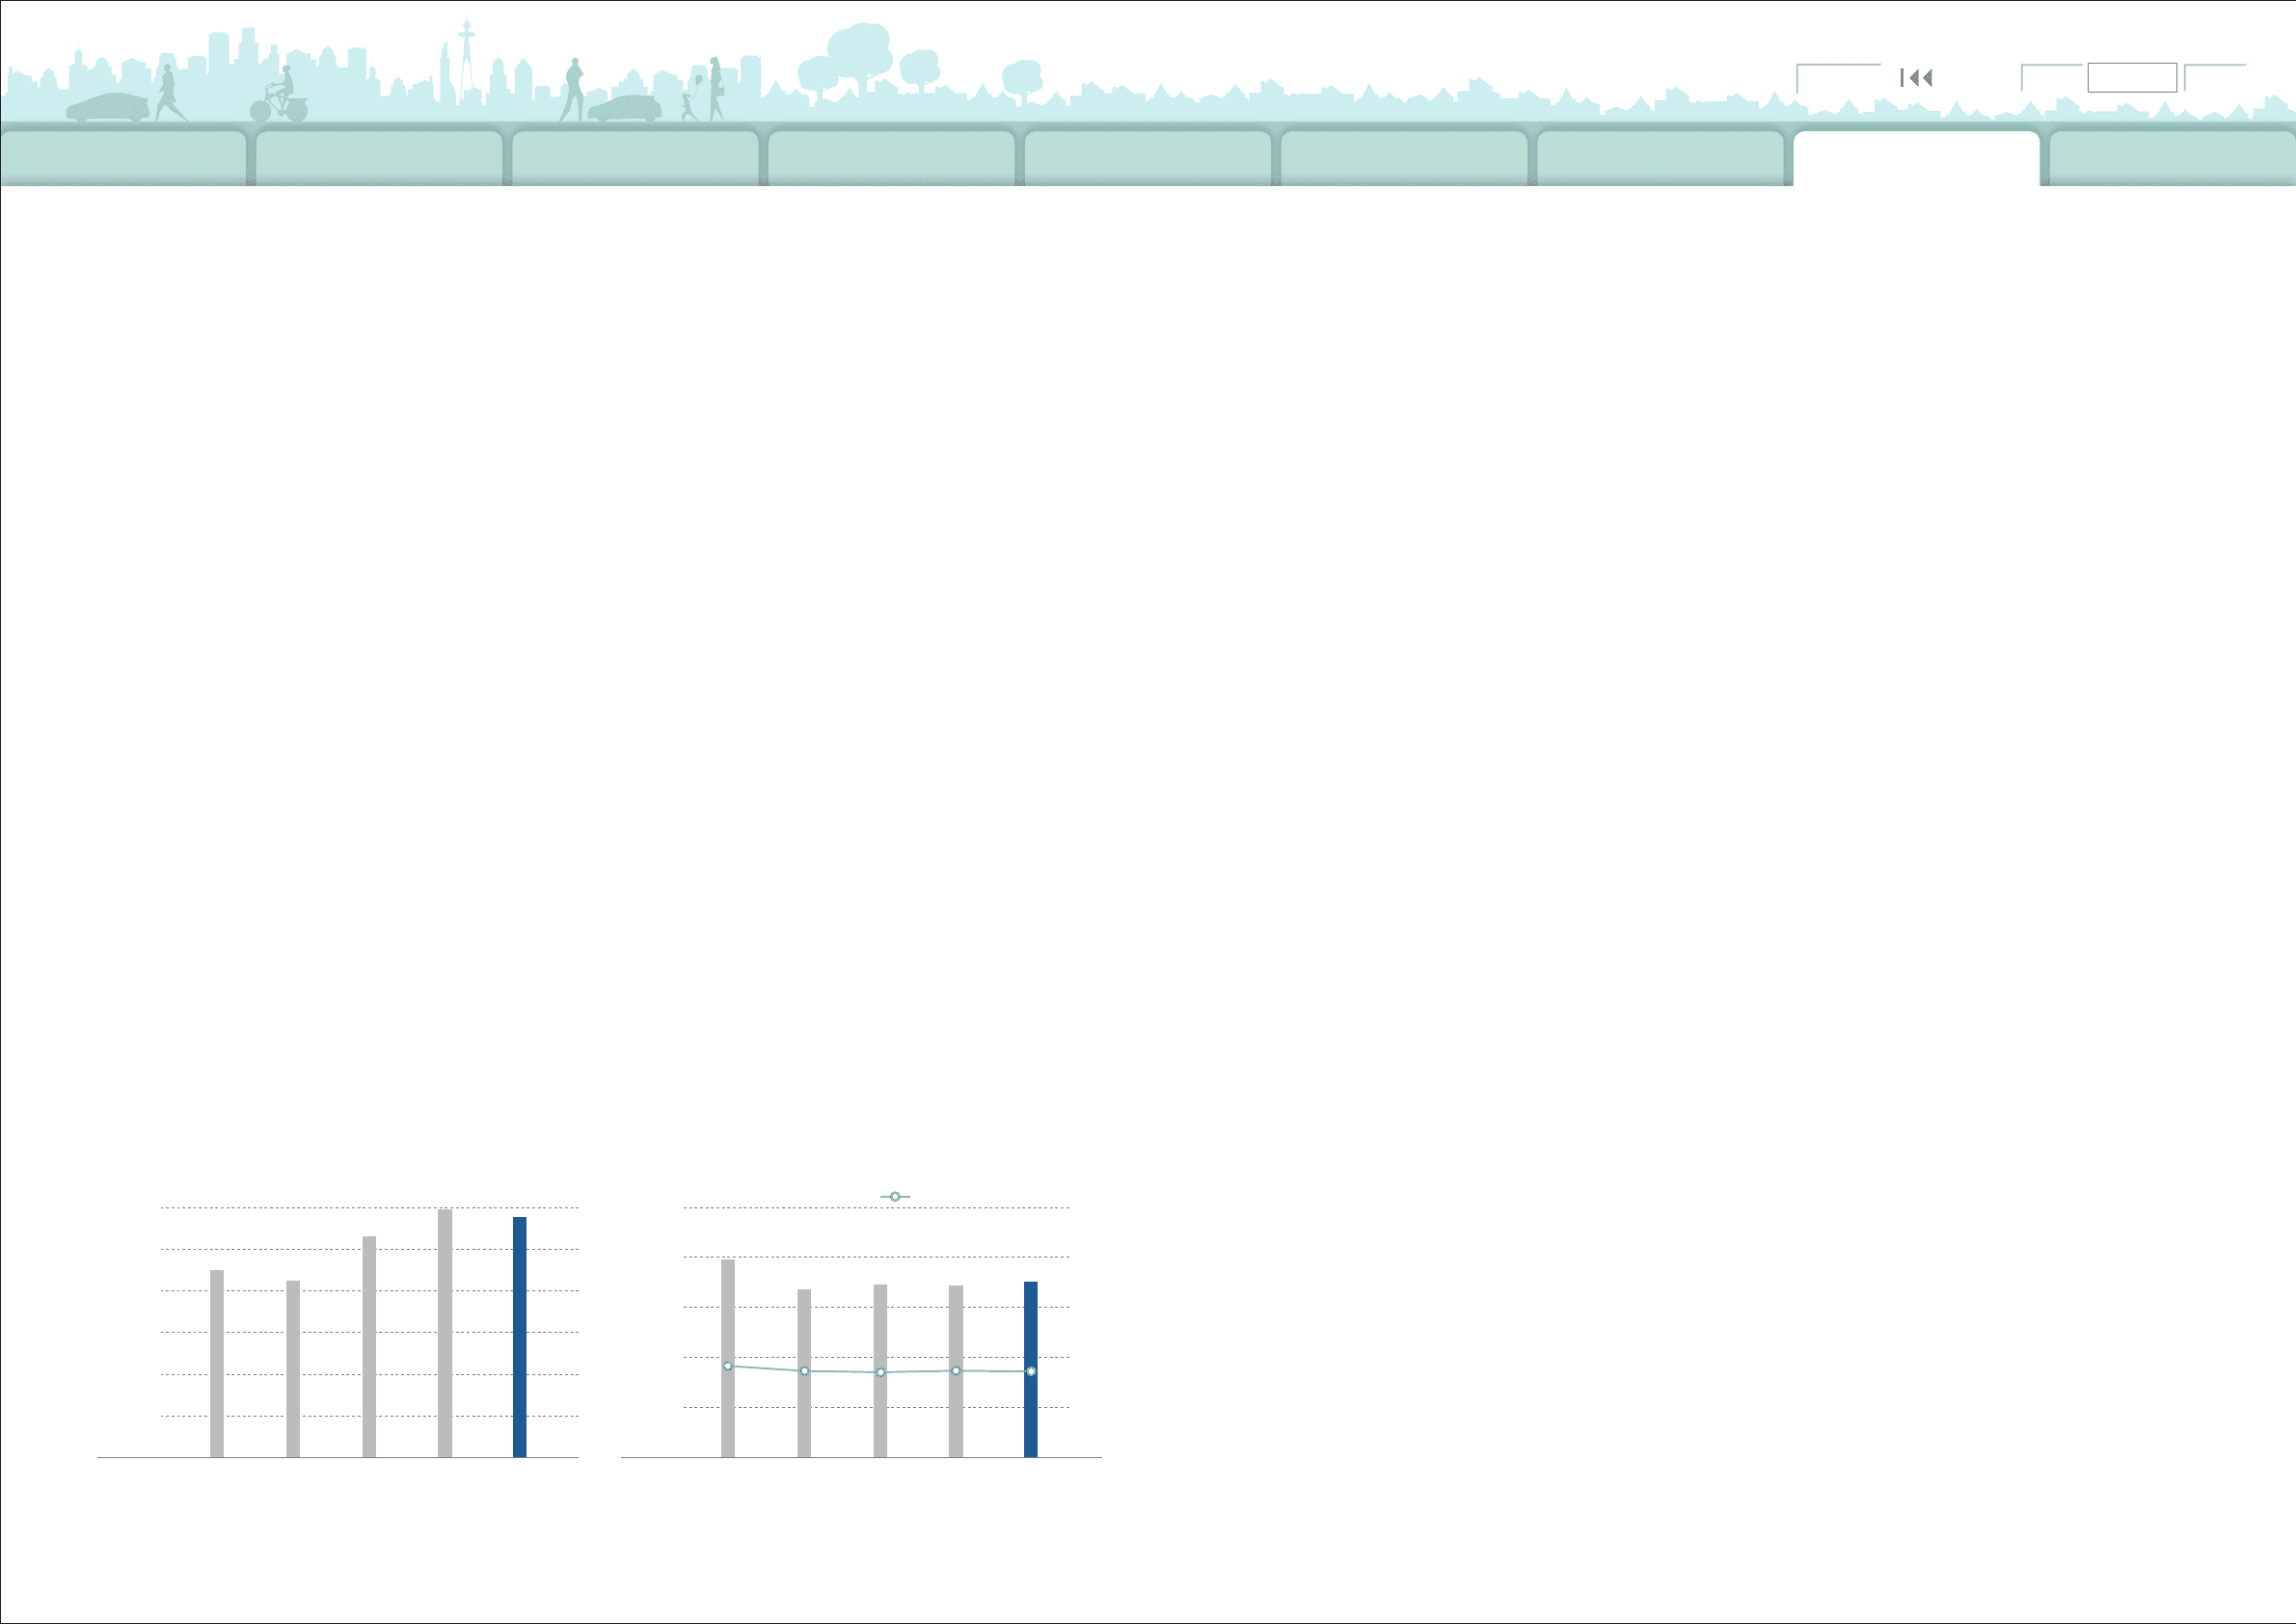
‘12‘09 ‘10‘08 ‘11
0
2,0 0 0
1,0 0 0
3,000
4,000
6,0 0 0
5,0 0 0
(¥ Billion)
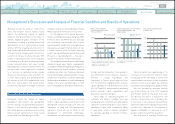
Liquid Assets*
* Cash and cash equivalents, time deposits, marketable debt
securities and investment in monetary trust funds
(¥ Billion) (%)
Equity ratio (Right scale)
6,000
3,000
9,00 0
12,00 0
15,0 0 0 10 0
80
60
40
20
00
‘12‘09 ‘10
‘08
‘11
Shareholders
Equity and Equity Ratio
0820
Search NextPrev page 69
Contents