Toyota 2012 Annual Report Download - page 106
Download and view the complete annual report
Please find page 106 of the 2012 Toyota annual report below. You can navigate through the pages in the report by either clicking on the pages listed below, or by using the keyword search tool below to find specific information within the annual report.-
 1
1 -
2
-
3
-
4
-
5
-
6
-
7
-
8
-
9
-
10
-
11
-
12
-
13
-
14
-
15
-
16
-
17
-
18
-
19
-
20
-
21
-
22
-
23
-
24
-
25
-
26
-
27
-
28
-
29
-
30
-
31
-
32
-
33
-
34
-
35
-
36
-
37
-
38
-
39
-
40
-
41
-
42
-
43
-
44
-
45
-
46
-
47
-
48
-
49
-
50
-
51
-
52
-
53
-
54
-
55
-
56
-
57
-
58
-
59
-
60
-
61
-
62
-
63
-
64
-
65
-
66
-
67
-
68
-
69
-
70
-
71
-
72
-
73
-
74
-
75
-
76
-
77
-
78
-
79
-
80
-
81
-
82
-
83
-
84
-
85
-
86
-
87
-
88
-
89
-
90
-
91
-
92
-
93
-
94
-
95
-
 96
96 -
 97
97 -
 98
98 -
 99
99 -
 100
100 -
 101
101 -
 102
102 -
 103
103 -
 104
104 -
 105
105 -
 106
106 -
 107
107 -
 108
108 -
 109
109 -
 110
110 -
 111
111 -
 112
112 -
 113
113 -
 114
114 -
 115
115 -
 116
116 -
117
-
118
-
119
-
120
-
121
-
122
-
123
-
124
-
125
-
126
-
127
 |
 |

TOYOTA ANNUAL REPORT 2012
Toyota Global Vision Changes for Making
Ever-Better Cars President
ʼ
s Message Medium- to Long-Term
Growth Initiatives Special Feature Management and
Corporate Information Investor Information
Business and
Performance Review Financial Section
Notes to Consolidated Financial Statements
The following is description of the assets,
information about the valuation techniques used
to measure fair value, key inputs and significant
assumptions:
Quoted market prices for identical securities
are used to measure fair value of common stocks.
Common stocks include 51% of Japanese stocks
and 49% of foreign stocks as of March 31, 2011,
and 52% of Japanese stocks and 48% of foreign
stocks as of March 31, 2012.
Quoted market prices for identical securities
are used to measure fair value of government
bonds. Government bonds include 25% of
Japanese government bonds and 75% of foreign
government bonds as of March 31, 2011, and
25% of Japanese government bonds and 75% of
foreign government bonds as of March 31, 2012.
Commingled funds are beneficial interests of
collective trust, which are mainly invested by the
parent company and Japanese subsidiaries. The
fair values of commingled funds are measured
using the net asset value
(“
NAV
”)
provided by the
administrator of the fund, and are categorized
by the ability to redeem investments at the
measurement day.
The fair values of insurance contracts are
measured using contracted amount with accrued
interest.
Other consists of cash equivalents, other
private placement investment funds and other
assets. The fair values of other private placement
investment funds are measured using the NAV
provided by the administrator of the fund, and are
categorized by the ability to redeem investments
at the measurement day.
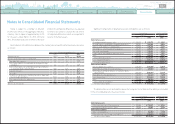
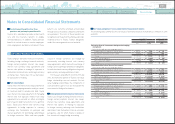
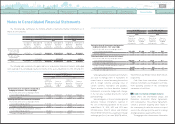
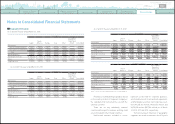
The following tables summarize the changes in Level 3 plan assets measured at fair value for the
years ended March 31, 2010, 2011 and 2012:
Yen in millions
For the year ended March 31, 2010
Debt securities Other Total
Balance at beginning of year ¥ 5,242 ¥ 45,825 ¥ 51,067
Actual return on plan assets 818
(
2,206
) (
1,388
)
Purchases, sales and settlements
(
2,233
)
3,467 1,234
Other
(
236
) (
568
) (
804
)
Balance at end of year ¥ 3,591 ¥ 46,518 ¥ 50,109
Yen in millions
For the year ended March 31, 2011
Debt securities Other Total
Balance at beginning of year ¥3,591 ¥ 46,518 ¥ 50,109
Actual return on plan assets 312 1,908 2,220
Purchases, sales and settlements
(
2,948
)
11,490 8,542
Other
(
209
) (
1,065
) (
1,274
)
Balance at end of year ¥ 746 ¥ 58,851 ¥59,597
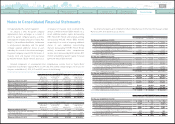
Yen in millions
For the year ended March 31, 2012
Debt securities Other Total
Balance at beginning of year ¥ 746 ¥ 58,851 ¥ 59,597
Actual return on plan assets 5
(
519
) (
514
)
Purchases, sales and settlements
(
160
)
12,967 12,807
Other
̶
143 143
Balance at end of year ¥ 591 ¥ 71,442 ¥ 72,033
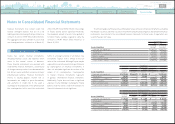
U.S. dollars in millions
For the year ended March 31, 2012
Debt securities Other Total
Balance at beginning of year $ 9 $ 716 $ 725
Actual return on plan assets 0
(
6
) (
6
)
Purchases, sales and settlements
(
2
)
158 156
Other
̶
1 1
Balance at end of year $ 7 $ 869 $ 876
Toyota expects to contribute ¥104,943 million
(
$1,277 million
)
to its pension plans in the year ending
March 31, 2013.
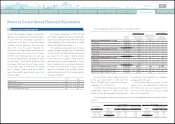
The following pension benefit payments, which reflect expected future service, as appropriate, are
expected to be paid:
Years ending March 31, Yen in millions
U.S. dollars in millions
2013 ¥ 69,352 $ 844
2014 71,472 869
2015 74,696 909
2016 77,750 946
2017 78,823 959
from 2018 to 2022 447,995 5,451
Total ¥ 820,088 $ 9,978
0820
Search NextPrev page 106
Contents