Toyota 2012 Annual Report Download - page 23
Download and view the complete annual report
Please find page 23 of the 2012 Toyota annual report below. You can navigate through the pages in the report by either clicking on the pages listed below, or by using the keyword search tool below to find specific information within the annual report.-
 1
1 -
2
-
3
-
4
-
5
-
6
-
7
-
8
-
9
-
10
-
11
-
12
-
 13
13 -
 14
14 -
 15
15 -
 16
16 -
 17
17 -
 18
18 -
 19
19 -
 20
20 -
 21
21 -
 22
22 -
 23
23 -
 24
24 -
 25
25 -
 26
26 -
 27
27 -
 28
28 -
 29
29 -
 30
30 -
 31
31 -
 32
32 -
 33
33 -
34
-
35
-
36
-
37
-
38
-
39
-
40
-
41
-
42
-
43
-
44
-
45
-
46
-
47
-
48
-
49
-
50
-
51
-
52
-
53
-
54
-
55
-
56
-
57
-
58
-
59
-
60
-
61
-
62
-
63
-
64
-
65
-
66
-
67
-
68
-
69
-
70
-
71
-
72
-
73
-
74
-
75
-
76
-
77
-
78
-
79
-
80
-
81
-
82
-
83
-
84
-
85
-
86
-
87
-
88
-
89
-
90
-
91
-
92
-
93
-
94
-
95
-
96
-
97
-
98
-
99
-
100
-
101
-
102
-
103
-
104
-
105
-
106
-
107
-
108
-
109
-
110
-
111
-
112
-
113
-
114
-
115
-
116
-
117
-
118
-
119
-
120
-
121
-
122
-
123
-
124
-
125
-
126
-
127
 |
 |
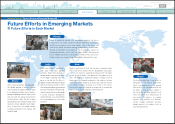
Toyota Global Vision Changes for Making
Ever-Better Cars President
ʼ
s Message Medium- to Long-Term
Growth Initiatives Special Feature Management and
Corporate Information Financial Section Investor Information
Business and
Performance Review
TOYOTA ANNUAL REPORT 2012
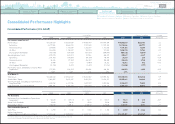
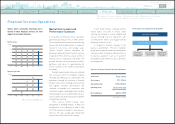
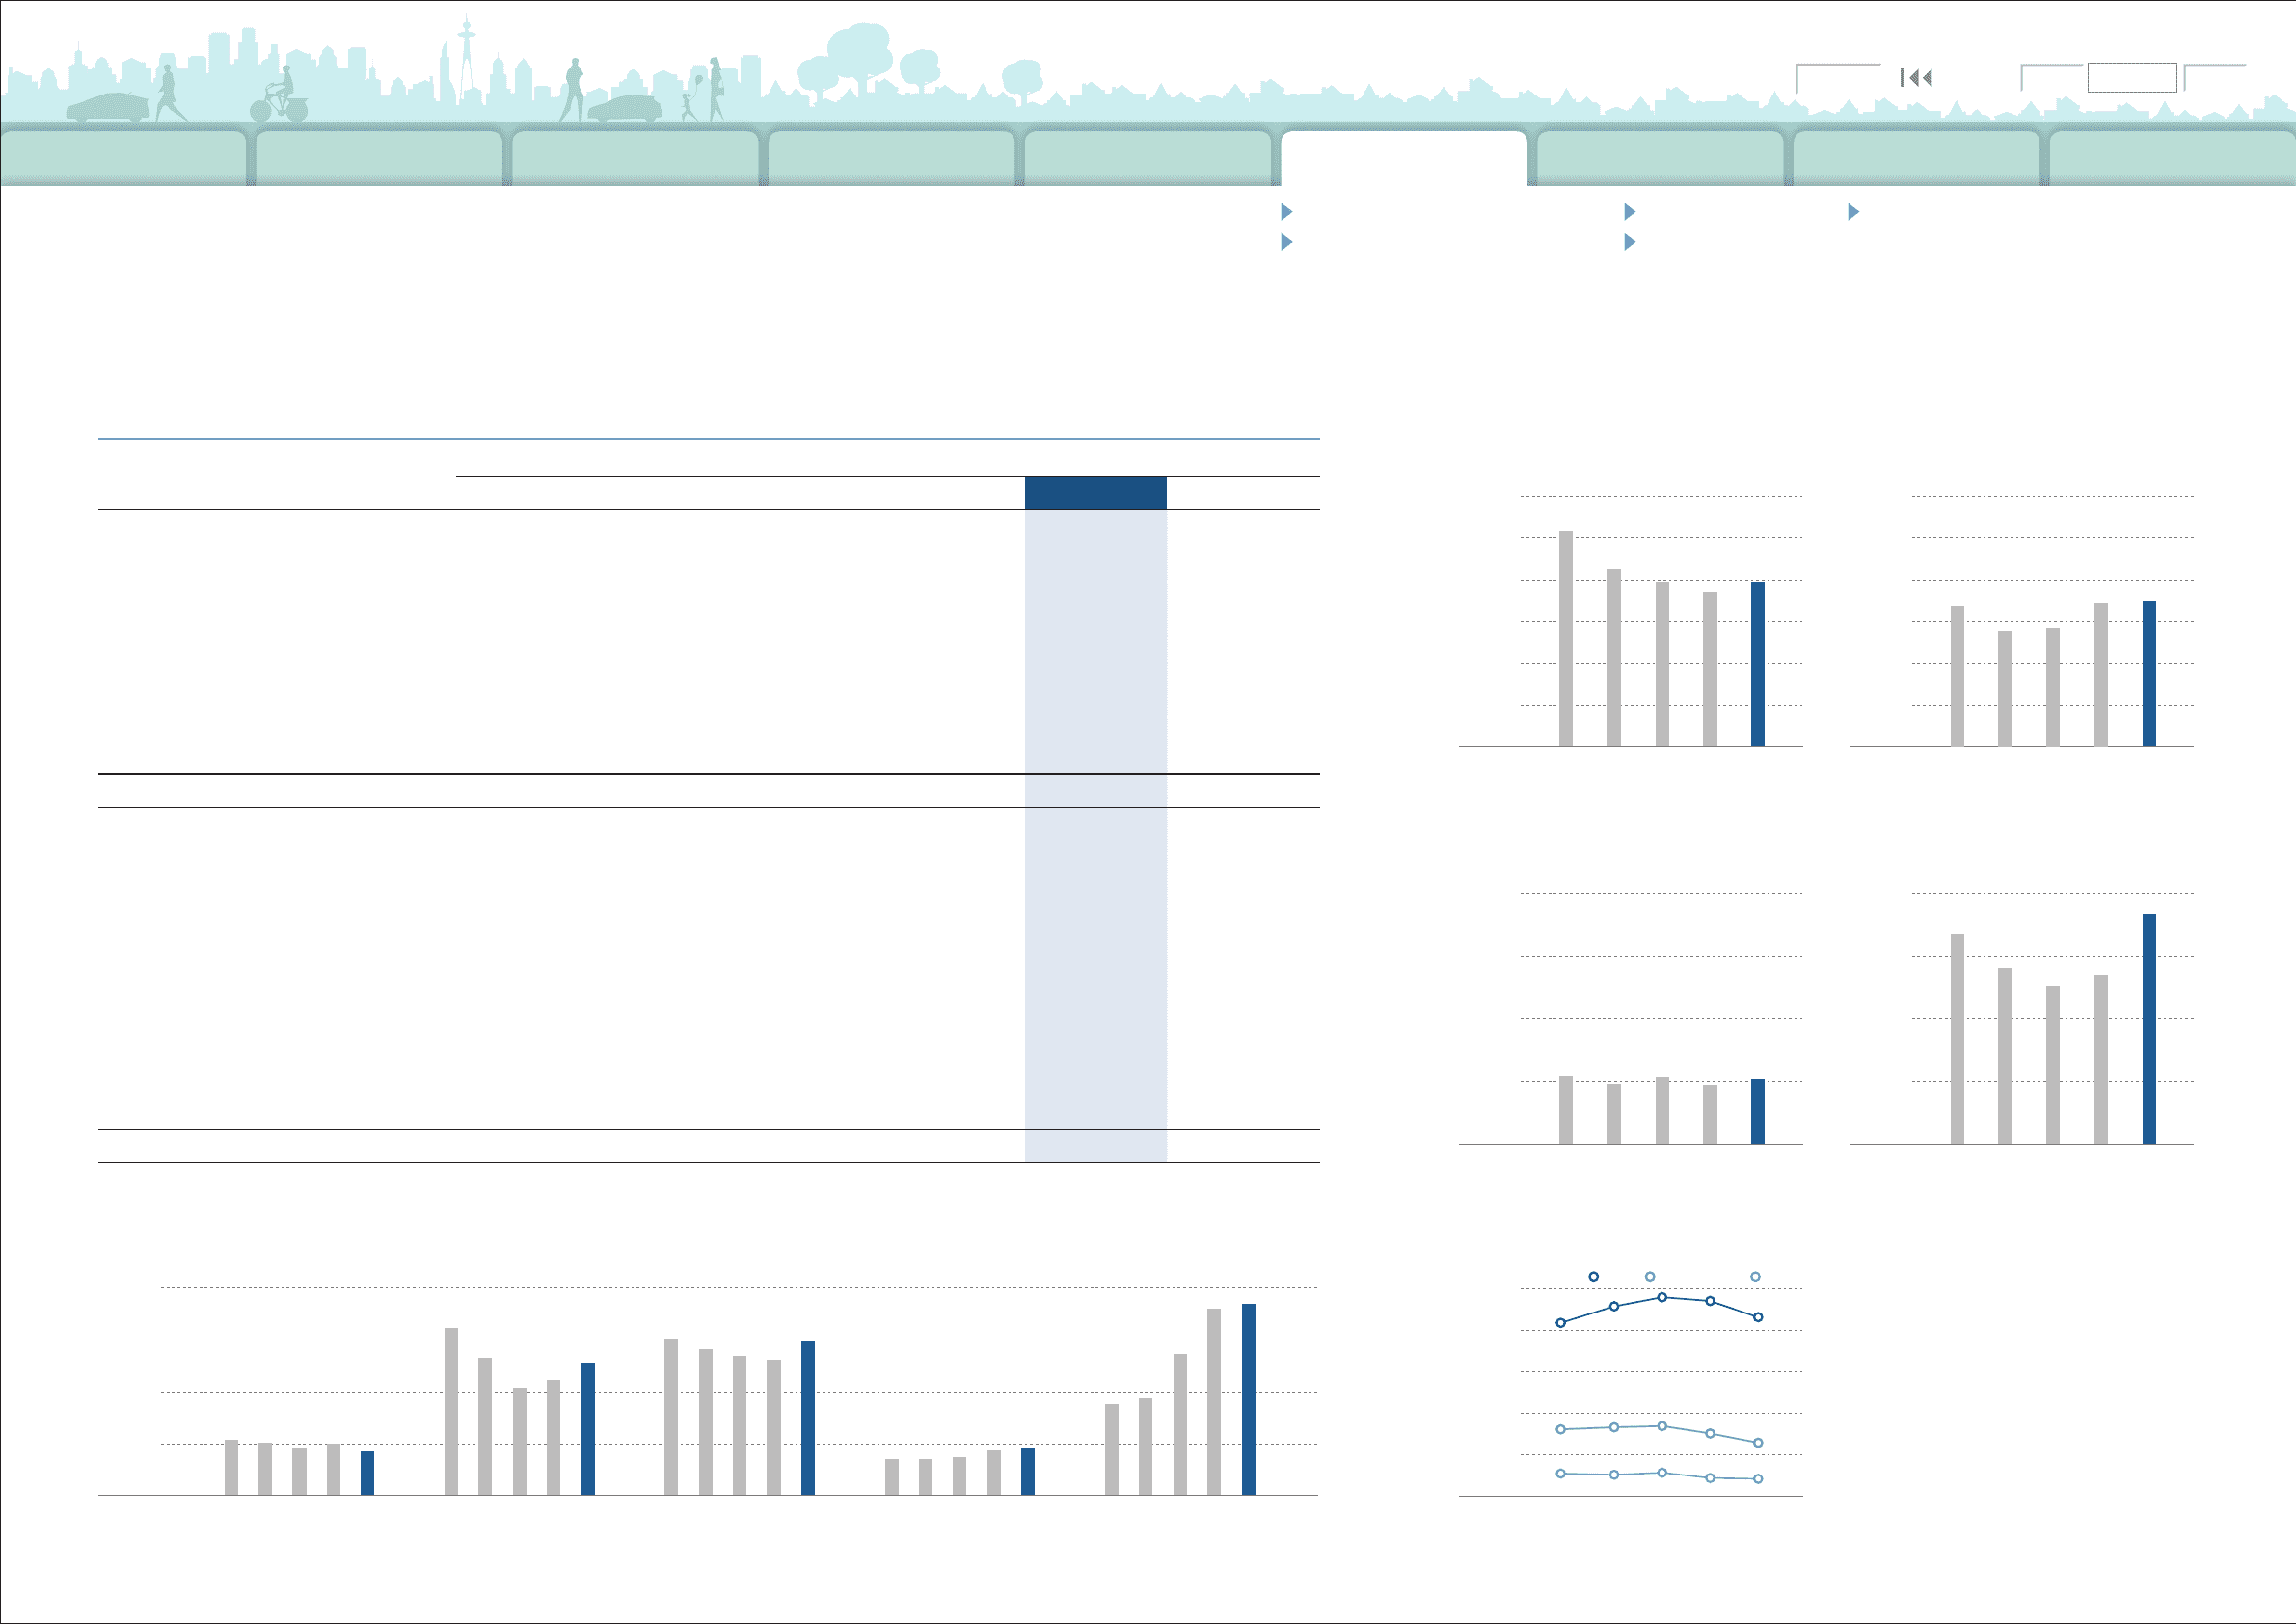
Thousands of units % change
For the years ended March 31 2008 2009 2010 2011 2012
2012 vs. 2011
Vehicle Production by Region:
Japan 5,160 4,255 3,956 3,721 3,940 +5.9
Overseas Total 3,387 2,796 2,853 3,448 3,495 +1.4
North America 1,268 919 1,042 1,338 1,275 -4.7
Europe 711 482 433 372 383 +3.0
Asia 961 947 1,021 1,344 1,441 +7.2
Central and South America 150 151 146 148 152 +2.7
Oceania 149 130 106 113 93 -17.7
Africa 148 167 105 133 151 +13.5
Consolidated Total 8,547 7,051 6,809 7,169 7,435 +3.7
Vehicle Sales by Region:
Japan 2,188 1,945 2,163 1,913 2,071 +8.3
Overseas Total 6,725 5,622 5,074 5,395 5,281 -2.1
North America 2,958 2,212 2,098 2,031 1,872 -7.8
Europe 1,284 1,062 858 796 798 +0.3
Asia 956 905 979 1,255 1,327 +5.7
Central and South America 320 279 231 281 289 +2.8
Oceania 289 261 251 248 223 -10.1
Africa 314 289 184 209 214 +2.4
Middle East 597 606 466 569 550 -3.3
Other 7 8 7 6 8+33.3
Consolidated Total 8,913 7,567 7,237 7,308 7,352 +0.6
Consolidated Performance Highlights
Consolidated Vehicle Production and Sales
Source: Toyota Motor Corporation
Note: Market definitions are as follows:
Europe: Germany, France, the United Kingdom, Italy,
Spain, the Netherlands, Belgium, Portugal,
Denmark, Greece, Ireland, Sweden, Austria,
Finland, Switzerland, Norway, Poland,
Hungary, and the Czech Republic
Asia: Indonesia, Thailand, the Philippines,
Malaysia, Singapore, Vietnam, Taiwan,
South Korea and Brunei Darussalam
Japan: Minivehicles included
Note: FY represents fiscal years ended March 31.
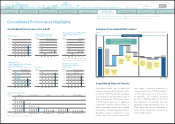
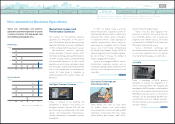
5,000
15,0 00
10,000
20,000
‘07 ‘07‘07‘07‘07‘08 ‘11‘10‘09 ‘08 ‘11‘10‘09‘08 ‘11‘10‘09‘08 ‘11‘10‘09‘08 ‘11‘10‘09
0
Japan United States Europe Asia China
(Thousands of units)
C
Principal Market Data: Automotive Market
(
Sales
)
1,000
3,000
2,000
5,000
4,000
6,000
‘08‘12‘11‘10‘09
0
1,000
3,000
2,000
5,000
4,000
6,000
‘08 ‘12‘11‘10‘09
0
(Thousands of units) (Thousands of units)
Vehicle Production
(
Japan
)
Vehicle Production
(
Overseas
)
20
10
40
30
50
()
0
‘08‘12‘11‘10‘09
Japan North America Europe
Share of Vehicle Sales by Markets
2,0 0 0
4,0 0 0
8,000
6,000
2,000
4,000
8,000
6,000
‘08‘12‘11‘10‘09
0
‘08 ‘12‘11‘10‘09
0
(Thousands of units) (Thousands of units)
Vehicle Sales
(
Japan
)
Vehicle Sales
(
Overseas
)
Search NextPrev page 23
Contents
0821
Automotive Operations Financial Services OperationsConsolidated Performance Highlights
Non-automotive Business Operations Impact of the Disasters and Recovery Efforts