Toyota 2012 Annual Report Download - page 121
Download and view the complete annual report
Please find page 121 of the 2012 Toyota annual report below. You can navigate through the pages in the report by either clicking on the pages listed below, or by using the keyword search tool below to find specific information within the annual report.-
 1
1 -
2
-
3
-
4
-
5
-
6
-
7
-
8
-
9
-
10
-
11
-
12
-
13
-
14
-
15
-
16
-
17
-
18
-
19
-
20
-
21
-
22
-
23
-
24
-
25
-
26
-
27
-
28
-
29
-
30
-
31
-
32
-
33
-
34
-
35
-
36
-
37
-
38
-
39
-
40
-
41
-
42
-
43
-
44
-
45
-
46
-
47
-
48
-
49
-
50
-
51
-
52
-
53
-
54
-
55
-
56
-
57
-
58
-
59
-
60
-
61
-
62
-
63
-
64
-
65
-
66
-
67
-
68
-
69
-
70
-
71
-
72
-
73
-
74
-
75
-
76
-
77
-
78
-
79
-
80
-
81
-
82
-
83
-
84
-
85
-
86
-
87
-
88
-
89
-
90
-
91
-
92
-
93
-
94
-
95
-
96
-
97
-
98
-
99
-
100
-
101
-
102
-
103
-
104
-
105
-
106
-
107
-
108
-
109
-
110
-
 111
111 -
 112
112 -
 113
113 -
 114
114 -
 115
115 -
 116
116 -
 117
117 -
 118
118 -
 119
119 -
 120
120 -
 121
121 -
 122
122 -
 123
123 -
 124
124 -
 125
125 -
 126
126 -
 127
127
 |
 |

TOYOTA ANNUAL REPORT 2012
Toyota Global Vision Changes for Making
Ever-Better Cars President
ʼ
s Message Medium- to Long-Term
Growth Initiatives Special Feature Management and
Corporate Information Investor Information
Business and
Performance Review Financial Section
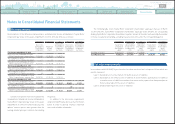
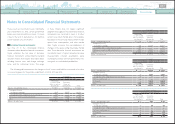
Notes to Consolidated Financial Statements
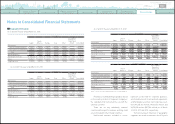
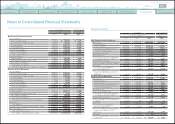
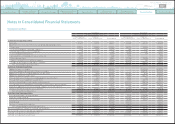
The following table summarizes the fair values of the assets and liabilities measured at fair value
on a recurring basis at March 31, 2011 and 2012:
The following is description of the assets and liabilities measured at fair value, information about
the valuation techniques used to measure fair value, key inputs and significant assumption:
Cash equivalents include money market funds
and other investments with original maturities of
three months or less. Cash equivalents classified
in Level 2 include primarily negotiable certificate
of deposit with original maturities of three months
or less. These are measured at fair value using
observable interest rates in the market. Time
deposits include negotiable certificate of deposit
with original maturities over three months. These
are measured at fair value using observable
interest rates in the market.
Marketable securities and other securities
investments include government bonds, common
stocks and other investments. Government bonds
include 77% of Japanese government bonds, and
23% of U.S. and European government bonds as of
March 31, 2011, and 60% of Japanese government
bonds, and 40% of U.S., European and other
government bonds as of March 31, 2012. Listed
stocks on the Japanese stock markets represent
86% and 83% of common stocks as of March 31,
2011 and 2012, respectively. Toyota uses quoted
market prices for identical assets to measure
fair value of these securities.
“
Other
”
includes
primarily commercial paper. Generally, Toyota
uses quoted market prices for similar assets
or quoted non-active market prices for identical
assets to measure fair value of these securities.
Yen in millions
March 31, 2011
Level 1 Level 2 Level 3 Total
Assets
Cash equivalents ¥ 729,569 ¥ 58,281 ¥
—
¥ 787,850
Time deposits
—
120,000
—
120,000
Marketable securities and other securities investments
Government bonds 3,127,170
—
—
3,127,170
Common stocks 960,229
—
—
960,229
Other 37,842 539,109
—
576,951
Derivative financial instruments
—
405,524 11,782 417,306
Total ¥4,854,810 ¥1,122,914 ¥11,782 ¥5,989,506
Liabilities
Derivative financial instruments ¥
—
¥
(
215,283
)
¥
(
4,988
)
¥
(
220,271
)
Total ¥
—
¥
(
215,283
)
¥
(
4,988
)
¥
(
220,271
)
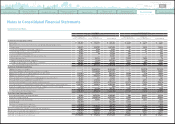
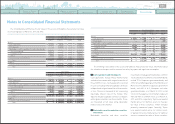
Yen in millions
March 31, 2012
Level 1 Level 2 Level 3 Total
Assets
Cash equivalents ¥ 485,119 ¥ 223,385 ¥
̶
¥ 708,504
Time deposits
̶
50,000
̶
50,000
Marketable securities and other securities investments
Government bonds 3,596,625 5,287
̶
3,601,912
Common stocks 1,034,319
̶
̶
1,034,319
Other 40,711 454,549 1,684 496,944
Derivative financial instruments
̶
289,931 7,565 297,496
Total ¥5,156,774 ¥1,023,152 ¥ 9,249 ¥6,189,175
Liabilities
Derivative financial instruments ¥
̶
¥
(
180,347
)
¥
(
2,826
)
¥
(
183,173
)
Total ¥
̶
¥
(
180,347
)
¥
(
2,826
)
¥
(
183,173
)
U.S. dollars in millions
March 31, 2012
Level 1 Level 2 Level 3 Total
Assets
Cash equivalents $ 5,902 $ 2,718 $
̶
$ 8,620
Time deposits
̶
609
̶
609
Marketable securities and other securities investments
Government bonds 43,760 64
̶
43,824
Common stocks 12,584
̶
̶
12,584
Other 496 5,530 21 6,047
Derivative financial instruments
̶
3,527 92 3,619
Total $ 62,742 $ 12,448 $ 113 $ 75,303
Liabilities
Derivative financial instruments $
̶
$
(
2,194
)
$
(
35
)
$
(
2,229
)
Total $
̶
$
(
2,194
)
$
(
35
)
$
(
2,229
)
■
Cash equivalents and time deposits
■
Marketable securities and other securities
investments
0820
Search NextPrev page 121
Contents