Toyota 2012 Annual Report Download - page 48
Download and view the complete annual report
Please find page 48 of the 2012 Toyota annual report below. You can navigate through the pages in the report by either clicking on the pages listed below, or by using the keyword search tool below to find specific information within the annual report.-
 1
1 -
2
-
3
-
4
-
5
-
6
-
7
-
8
-
9
-
10
-
11
-
12
-
13
-
14
-
15
-
16
-
17
-
18
-
19
-
20
-
21
-
22
-
23
-
24
-
25
-
26
-
27
-
28
-
29
-
30
-
31
-
32
-
33
-
34
-
35
-
36
-
37
-
 38
38 -
 39
39 -
 40
40 -
 41
41 -
 42
42 -
 43
43 -
 44
44 -
 45
45 -
 46
46 -
 47
47 -
 48
48 -
 49
49 -
 50
50 -
 51
51 -
 52
52 -
 53
53 -
 54
54 -
 55
55 -
 56
56 -
 57
57 -
 58
58 -
59
-
60
-
61
-
62
-
63
-
64
-
65
-
66
-
67
-
68
-
69
-
70
-
71
-
72
-
73
-
74
-
75
-
76
-
77
-
78
-
79
-
80
-
81
-
82
-
83
-
84
-
85
-
86
-
87
-
88
-
89
-
90
-
91
-
92
-
93
-
94
-
95
-
96
-
97
-
98
-
99
-
100
-
101
-
102
-
103
-
104
-
105
-
106
-
107
-
108
-
109
-
110
-
111
-
112
-
113
-
114
-
115
-
116
-
117
-
118
-
119
-
120
-
121
-
122
-
123
-
124
-
125
-
126
-
127
 |
 |
TOYOTA ANNUAL REPORT 2012
Toyota Global Vision Changes for Making
Ever-Better Cars President
ʼ
s Message Medium- to Long-Term
Growth Initiatives Special Feature Management and
Corporate Information Investor Information
Business and
Performance Review Financial Section
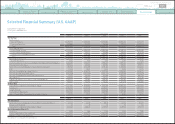
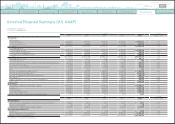
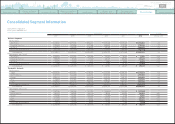
Consolidated Quarterly Financial Summary
Yen in billions
2011 2012
First Quarter Second Quarter Third Quarter Fourth Quarter First Quarter Second Quarter Third Quarter Fourth Quarter
Net Revenues ¥ 4,871.8 ¥4,806.7 ¥4,673.1 ¥4,642.0 ¥3,441.0 ¥ 4,574.9 ¥ 4,865.2 ¥ 5,702.5
% Change 27.0% 5.8%
-
11.7%
-
12.1%
-
29.4%
-
4.8% 4.1% 22.8%
Operating Income
(
Loss
)
211.6 111.5 99.0 46.1
(
108.0
)
75.4 149.6 238.5
% Change
―
% 92.2%
-
47.6%
-
51.6%
―
%
-
32.4% 51.1% 417.5%
Operating Income Margin 4.3% 2.3% 2.1% 1.0%
-
3.1% 1.6% 3.1% 4.2%
Income
(
Loss
)
before Income Taxes and
Equity in Earnings of Affiliated Companies
263.0 129.1 129.6 41.5
(
80.5
)
79.1 198.6 235.6
% Change
―
% 70.9%
-
42.3%
-
67.9%
―
%
-
38.7% 53.2% 467.2%
Net Income
(
Loss
)
attributable to
Toyota Motor Corporation 190.4 98.7 93.6 25.4 1.1 80.4 80.9 121.0
% Change
―
% 352.0%
-
38.9%
-
77.4%
-
99.4%
-
18.5%
-
13.5% 376.5%
Business Segment:
Net Revenues:
Automotive ¥ 4,467.8 ¥ 4,395.8 ¥ 4,255.1 ¥ 4,218.5 ¥3,060.8 ¥ 4,183.1 ¥ 4,471.4 ¥ 5,279.0
Financial Services 307.6 296.3 297.5 290.8 285.8 271.0 271.5 272.0
All Other 212.9 233.5 238.0 287.8 190.5 255.2 272.2 331.0
Intersegment Elimination
(
116.5
) (
118.9
) (
117.5
) (
155.1
)(
96.1
) (
134.4
) (
149.9
) (
179.6
)
Consolidated ¥ 4,871.8 ¥ 4,806.7 ¥ 4,673.1 ¥ 4,642.0 ¥3,441.0 ¥ 4,574.9 ¥ 4,865.2 ¥ 5,702.5
Operating Income
(
Loss
)
:
Automotive ¥ 96.7 ¥ 33.0 ¥
(
27.5
)
¥
(
16.2
)
¥
(
202.5
)
¥
(
7.5
)
¥ 57.1 ¥ 175.4
Financial Services 115.1 68.6 116.4 58.1 94.6 76.4 83.5 51.9
All Other 4.0 10.7 13.4 7.1
(
2.0
)
9.9 15.3 18.8
Intersegment Elimination
(
4.2
) (
0.8
) (
3.3
) (
2.9
)
1.9
(
3.4
) (
6.3
) (
6.7
)
Consolidated ¥ 211.6 ¥ 111.5 ¥ 99.0 ¥ 46.1 ¥
(
108.0
)
¥ 75.4 ¥ 149.6 ¥ 238.5
Geographic Segment:
Net Revenues:
Japan ¥ 2,806.6 ¥ 2,919.6 ¥ 2,686.1 ¥ 2,573.9 ¥1,784.5 ¥ 2,869.0 ¥ 3,024.2 ¥ 3,489.6
North America 1,483.6 1,337.6 1,333.3 1,274.5 853.5 1,085.7 1,379.5 1,432.9
Europe 459.8 465.3 524.2 532.1 459.9 499.2 527.0 507.8
Asia 834.9 794.2 835.1 910.5 700.0 827.3 704.2 1,102.9
Other 453.7 408.0 489.7 457.7 368.8 455.3 460.2 475.9
Intersegment Elimination
(
1,166.8
) (
1,118.0
) (
1,195.3
) (
1,106.7
)(
725.7
) (
1,161.6
) (
1,229.9
) (
1,306.7
)
Consolidated ¥4,871.8 ¥ 4,806.7 ¥ 4,673.1 ¥ 4,642.0 ¥3,441.0 ¥ 4,574.9 ¥ 4,865.2 ¥ 5,702.5
Operating Income
(
Loss
)
:
Japan ¥
(
27.5
)
¥
(
24.5
)
¥
(
122.4
)
¥
(
188.0
)
¥
(
206.6
)
¥
(
69.3
)
¥
(
30.5
)
¥ 99.4
North America 109.7 36.1 105.2 88.4 28.9 32.5 90.3 34.5
Europe
(
6.8
) (
2.1
)
2.2 19.8
(
7.5
)
5.6 10.4 9.2
Asia 90.2 74.0 68.6 80.2 60.1 70.4 40.5 85.7
Other 41.0 31.9 44.3 42.9 21.0 37.1 37.9 12.8
Intersegment Elimination 5.0
(
3.9
)
1.1 2.8
(
3.9
) (
0.9
)
1.0
(
3.3
)
Consolidated ¥ 211.6 ¥ 111.5 ¥ 99.0 ¥ 46.1 ¥
(
108.0
)
¥ 75.4 ¥ 149.6 ¥ 238.5
Toyota Motor Corporation
Fiscal years ended March 31
0820
Search NextPrev page 48
Contents