Toyota 2012 Annual Report Download - page 25
Download and view the complete annual report
Please find page 25 of the 2012 Toyota annual report below. You can navigate through the pages in the report by either clicking on the pages listed below, or by using the keyword search tool below to find specific information within the annual report.-
 1
1 -
2
-
3
-
4
-
5
-
6
-
7
-
8
-
9
-
10
-
11
-
12
-
13
-
14
-
 15
15 -
 16
16 -
 17
17 -
 18
18 -
 19
19 -
 20
20 -
 21
21 -
 22
22 -
 23
23 -
 24
24 -
 25
25 -
 26
26 -
 27
27 -
 28
28 -
 29
29 -
 30
30 -
 31
31 -
 32
32 -
 33
33 -
 34
34 -
 35
35 -
36
-
37
-
38
-
39
-
40
-
41
-
42
-
43
-
44
-
45
-
46
-
47
-
48
-
49
-
50
-
51
-
52
-
53
-
54
-
55
-
56
-
57
-
58
-
59
-
60
-
61
-
62
-
63
-
64
-
65
-
66
-
67
-
68
-
69
-
70
-
71
-
72
-
73
-
74
-
75
-
76
-
77
-
78
-
79
-
80
-
81
-
82
-
83
-
84
-
85
-
86
-
87
-
88
-
89
-
90
-
91
-
92
-
93
-
94
-
95
-
96
-
97
-
98
-
99
-
100
-
101
-
102
-
103
-
104
-
105
-
106
-
107
-
108
-
109
-
110
-
111
-
112
-
113
-
114
-
115
-
116
-
117
-
118
-
119
-
120
-
121
-
122
-
123
-
124
-
125
-
126
-
127
 |
 |

Toyota Global Vision Changes for Making
Ever-Better Cars President
ʼ
s Message Medium- to Long-Term
Growth Initiatives Special Feature Management and
Corporate Information Financial Section Investor Information
Business and
Performance Review
TOYOTA ANNUAL REPORT 2012
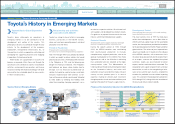
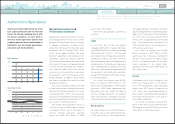
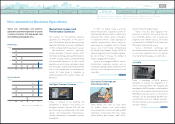
Automotive Operations
Despite a decrease in sales
(
mainly of IMVs
)
caused by supply shortages resulting from
the Thailand floods, consolidated vehicle sales
in Asia in fiscal 2012 rose 72 thousand units,
or 5.7% year-on-year, to 1,327 thousand units,
setting a new record. This was due in part to
strong sales of the Etios in India. Consolidated
vehicle production was up 97 thousand units, or
7.2% year-on-year, to 1,441 thousand units.
As a result, net revenues were ¥3,334.2
billion, a decline of ¥40.3 billion or 1.2% year-on-
year. Operating income was also down ¥56.2
billion, or 18.0% year-on-year, due to increased
expenses. Sales in China, which continues to
experience strong economic growth, reached
883 thousand units in 2011, a year-on-year
increase of 4.4%.
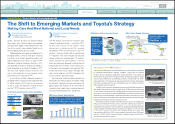
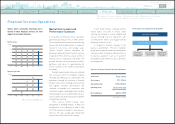
Asia Other Regions
(
such as Central and South America,
Oceania, Africa, the Middle East
)
Note:UnitsalesguresforChinaincludedomesticallyproduced
unitsaswellasunitsimportedfromJapan.
Consolidated sales for these regions in fiscal
2012 totaled 1,284 thousand units, a decrease of
29 thousand or 2.2% year-on-year. Consolidated
vehicle production was 396 thousand units, an
increase of 2 thousand or 0.4% compared with
the previous year.
As a result, net revenue was ¥1,760.1 billion,
a year-on-year decrease of 2.7% or ¥48.9 billion,
while operating income was also lower by ¥51.3
billion or 32.0% year-on-year, to ¥108.8 billion.
Search NextPrev page 25
Contents
0821
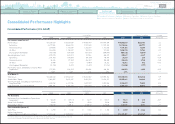
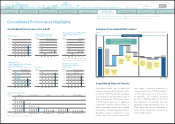
Automotive Operations Financial Services OperationsConsolidated Performance Highlights
Non-automotive Business Operations Impact of the Disasters and Recovery Efforts