Toyota 2012 Annual Report Download - page 22
Download and view the complete annual report
Please find page 22 of the 2012 Toyota annual report below. You can navigate through the pages in the report by either clicking on the pages listed below, or by using the keyword search tool below to find specific information within the annual report.-
 1
1 -
2
-
3
-
4
-
5
-
6
-
7
-
8
-
9
-
10
-
11
-
 12
12 -
 13
13 -
 14
14 -
 15
15 -
 16
16 -
 17
17 -
 18
18 -
 19
19 -
 20
20 -
 21
21 -
 22
22 -
 23
23 -
 24
24 -
 25
25 -
 26
26 -
 27
27 -
 28
28 -
 29
29 -
 30
30 -
 31
31 -
 32
32 -
33
-
34
-
35
-
36
-
37
-
38
-
39
-
40
-
41
-
42
-
43
-
44
-
45
-
46
-
47
-
48
-
49
-
50
-
51
-
52
-
53
-
54
-
55
-
56
-
57
-
58
-
59
-
60
-
61
-
62
-
63
-
64
-
65
-
66
-
67
-
68
-
69
-
70
-
71
-
72
-
73
-
74
-
75
-
76
-
77
-
78
-
79
-
80
-
81
-
82
-
83
-
84
-
85
-
86
-
87
-
88
-
89
-
90
-
91
-
92
-
93
-
94
-
95
-
96
-
97
-
98
-
99
-
100
-
101
-
102
-
103
-
104
-
105
-
106
-
107
-
108
-
109
-
110
-
111
-
112
-
113
-
114
-
115
-
116
-
117
-
118
-
119
-
120
-
121
-
122
-
123
-
124
-
125
-
126
-
127
 |
 |
Toyota Global Vision Changes for Making
Ever-Better Cars President
ʼ
s Message Medium- to Long-Term
Growth Initiatives Special Feature Management and
Corporate Information Financial Section Investor Information
Business and
Performance Review
TOYOTA ANNUAL REPORT 2012
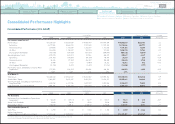
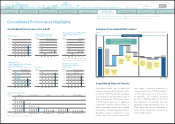
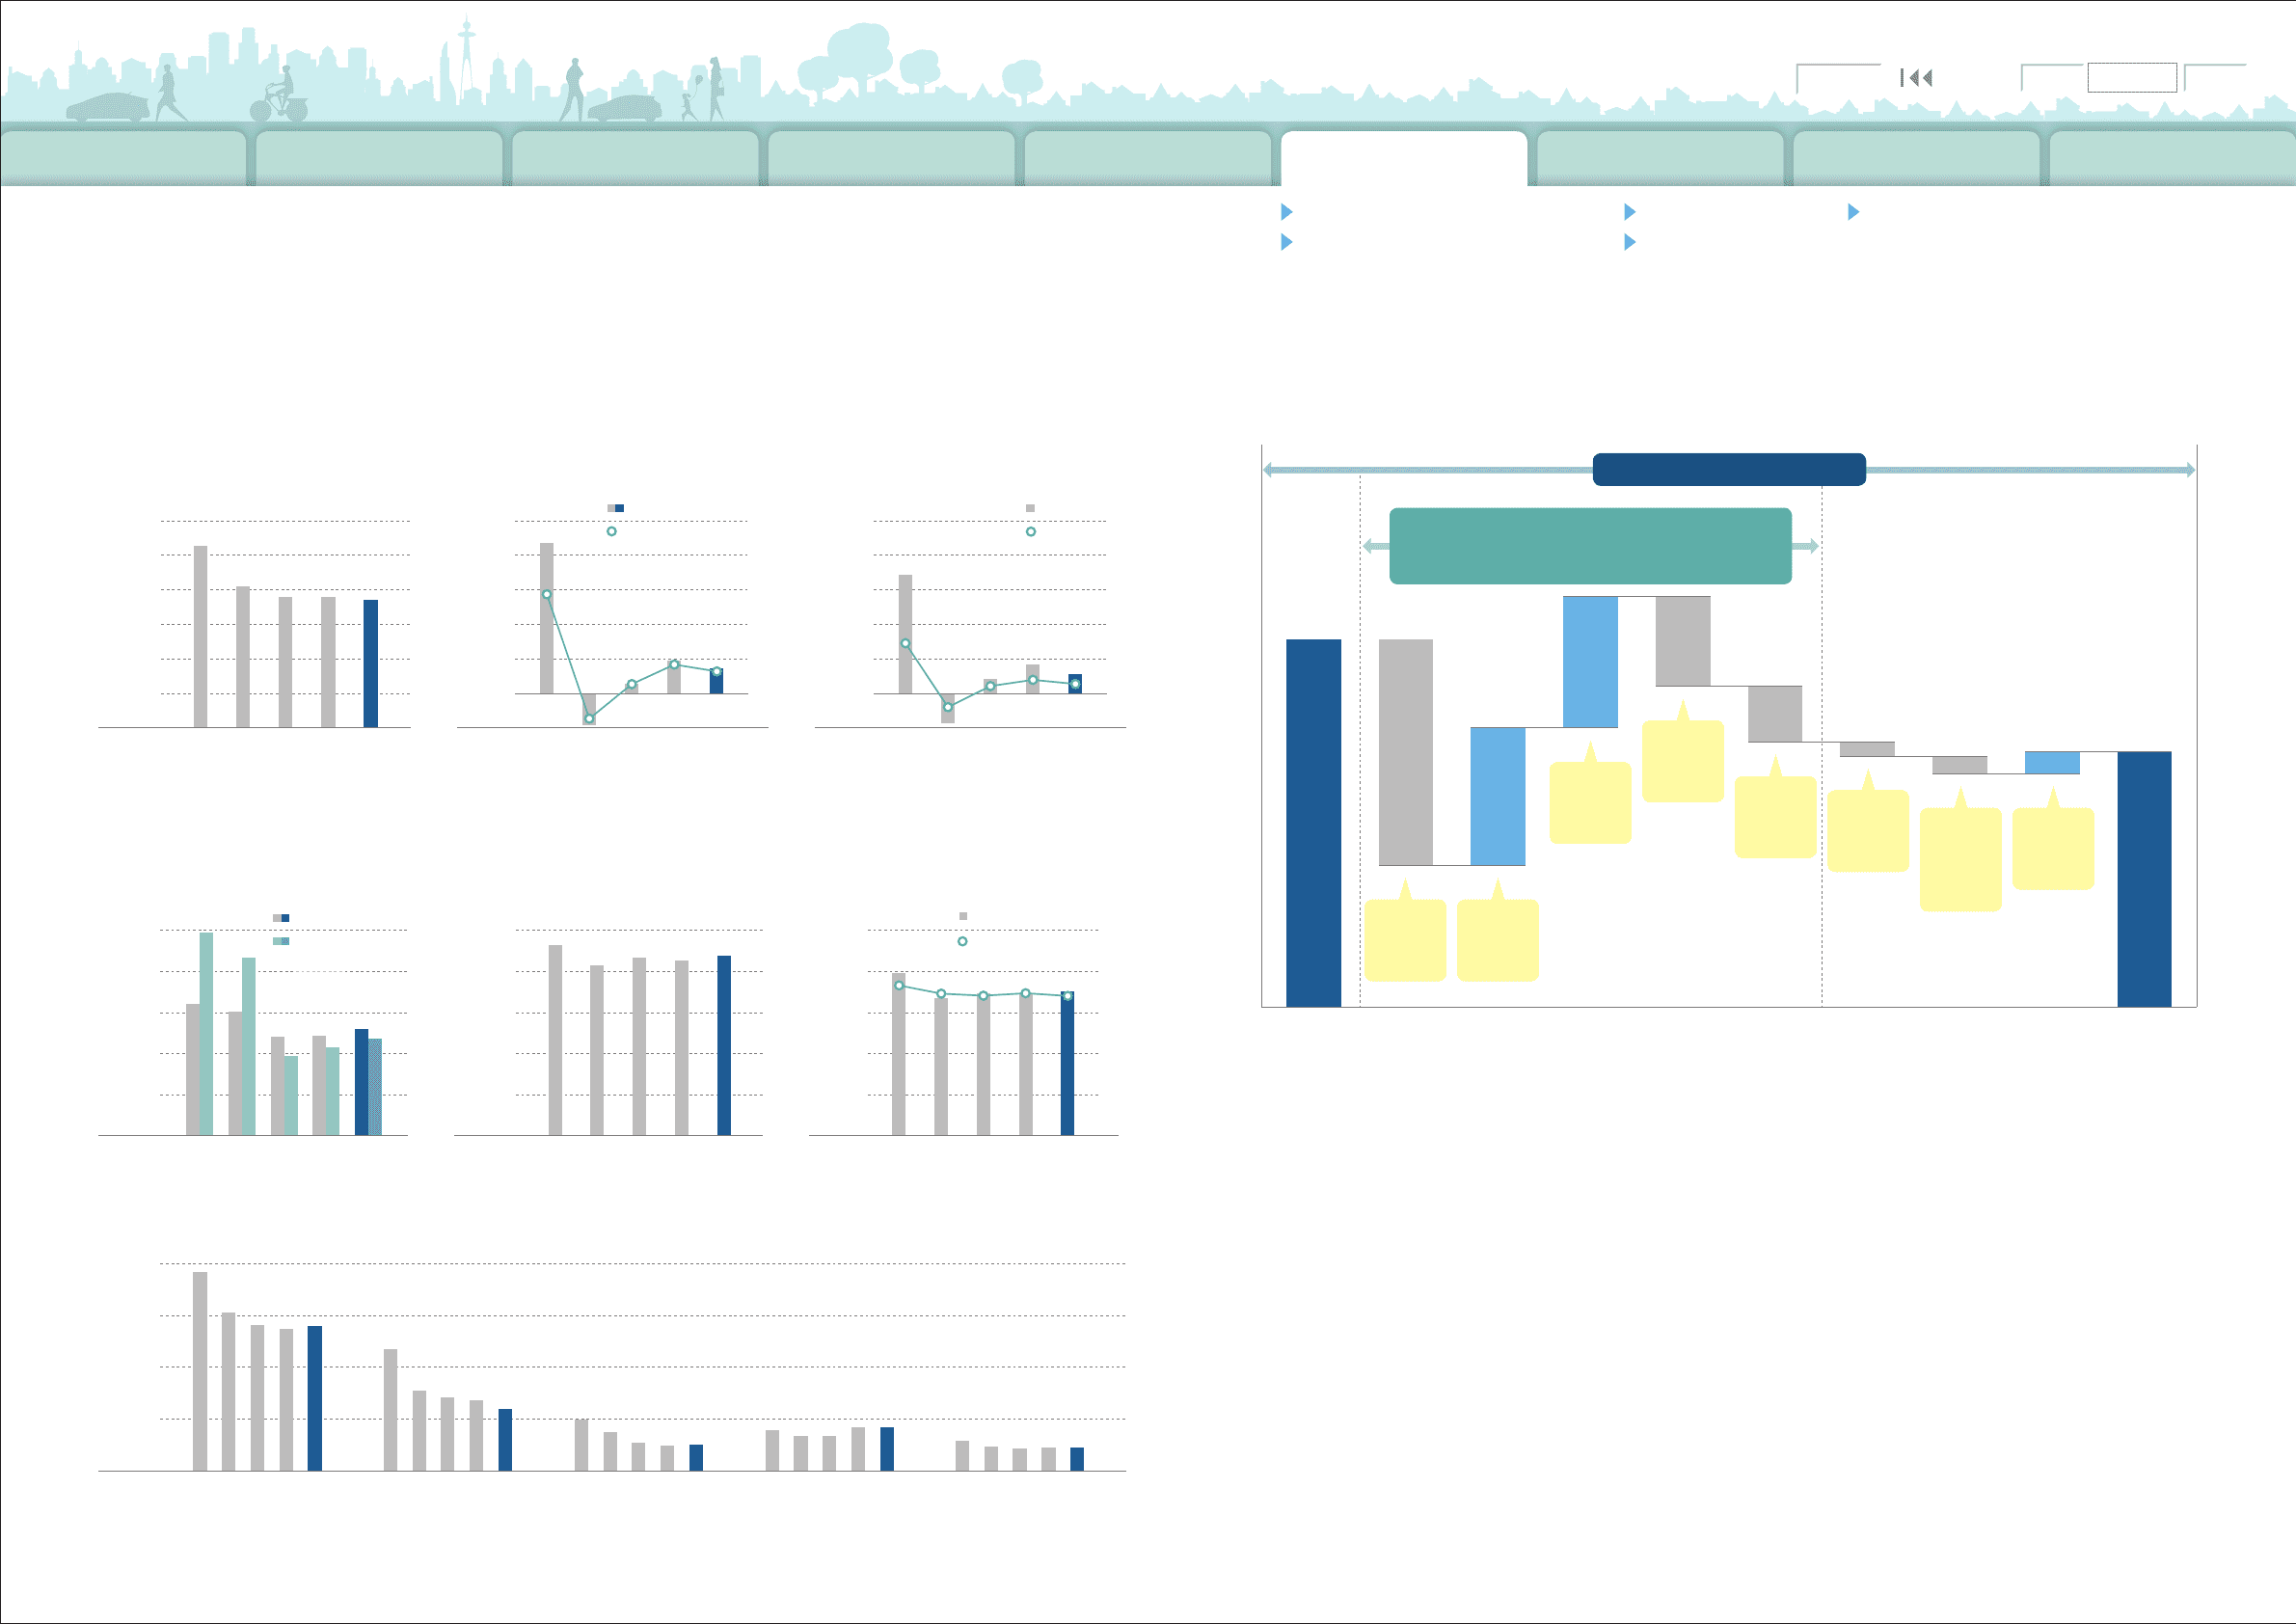
Consolidated Financial Results
-
Net Income
(
Loss
)
attributable to
Toyota Motor Corporation
- ROE
5,000
15,0 00
10,000
25,000
20,000
30,000
(¥ Billion)
‘08 ‘12‘11‘10‘09
0
(¥ Billion)
‘08 ‘12‘11‘10‘09
-500 -3
1,000
500
2,000
1,500
2,500 15
12
9
6
3
(¥ Billion) () ()
‘08 ‘12‘11‘10‘09
0
-500
1,000
500
2,000
1,500
2,500
00
-10
50
40
30
20
10
0
Operating Income
Operating Income Ratio
Net Income
ROE
Net Revenues
- Operating Income
(
Loss
)
- Operating Income Ratio
4,0 0 0
12,00 0
8,0 00
16,0 0 0
Japan North America Europe Asia Other Regions
‘08 ‘11‘10‘09 ‘12 ‘08 ‘11‘10‘09 ‘12‘08 ‘11‘10‘09 ‘12‘08 ‘11‘10‘09 ‘12‘08 ‘11‘10‘09 ‘12
0
(¥ Billion)
Net Revenues by Region
Consolidated Performance
(
U.S. GAAP
)
Analysis of Consolidated Net Income*
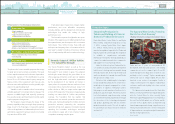
Consolidated vehicle sales in Japan and
overseas increased by 44 thousand units,
or 0.6%, to 7,352 thousand units compared
to the previous fiscal year. Vehicle sales in
Japan increased by 158 thousand units,
or 8.2% year-on-year, due to aggressive
new product launches and the efforts of
dealers nationwide. Market share, including
mini-vehicles, retained a high level at 43.2%.
Meanwhile, despite an expansion of sales
in Asia, lower sales in North America and
other regions resulted in a decrease in
overseas vehicle sales of 114 thousand units,
or 2.1% year-on-year. As for the results
of operations, net revenues decreased
by 2.2%, to ¥18,583.6 billion for the fiscal
year compared to the previous year, and
operating income decreased by 24.1%, to
¥355.6 billion. Net income attributable to
Toyota Motor Corporation decreased by
30.5%, to ¥283.5 billion.
300
900
600
1,200
1,500
‘08 ‘12‘11‘10‘09
0
‘08 ‘12‘11‘10‘09
14,000
7,000
28,000
21,00 0
35,000
()
‘08 ‘12‘11‘10‘09
R&D Expenses
0
6,000
3,000
12,000
9,000
15,000
0
50
40
20
30
10
0
Shareholders’ Equity
Shareholders' Equity to
Total Assets
(¥ Billion) (¥ Billion)
(¥ Billion)
Capital Expenditures for
Property, Plant and
Equipment
- Shareholders' Equity
- Shareholders' Equity to
Total Assets
- R&D Expenses
-
Capital Expenditures for Property,
Plant and Equipment
(
excluding vehicles and equipment of operating leases
)
Total Assets
Note: FY represents fiscal years ended March 31.
Note:
“
Net Income attributable to Toyota Motor
Corporation
”
, equivalent to
“
Net Income
”
up to 2009.
Consolidated Performance Highlights
* Net income attributable to Toyota Motor Corporation
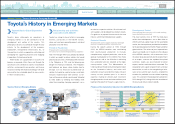
Search NextPrev page 22
Contents
0821
(¥ Billion)
‘10/4 ∼‘11/3
408.1
283.5
‘11/4 ∼‘12/3
Net Income*
(
-124.6
)
Operating Income
(
-112.6
)
Excluding Valuation Gains/Losses
from Interest Rate Swaps
(
-91.8
)
Effects
of FOREX
Rates
-250.0
Marketing
Efforts
+150.0
Other
-62.6
Increase in
Expenses,
etc.
-100.0
Cost-
Reduction
Efforts
+150.0
Non-
Operating
Income
-17.7
Equity in
Earnings of
Affiliated
Companies
-17.3
Income
Tax, etc.
+23.0
Automotive Operations Financial Services OperationsConsolidated Performance Highlights
Non-automotive Business Operations Impact of the Disasters and Recovery Efforts