Toyota 2012 Annual Report Download - page 16
Download and view the complete annual report
Please find page 16 of the 2012 Toyota annual report below. You can navigate through the pages in the report by either clicking on the pages listed below, or by using the keyword search tool below to find specific information within the annual report.-
 1
1 -
2
-
3
-
4
-
5
-
 6
6 -
 7
7 -
 8
8 -
 9
9 -
 10
10 -
 11
11 -
 12
12 -
 13
13 -
 14
14 -
 15
15 -
 16
16 -
 17
17 -
 18
18 -
 19
19 -
 20
20 -
 21
21 -
 22
22 -
 23
23 -
 24
24 -
 25
25 -
 26
26 -
27
-
28
-
29
-
30
-
31
-
32
-
33
-
34
-
35
-
36
-
37
-
38
-
39
-
40
-
41
-
42
-
43
-
44
-
45
-
46
-
47
-
48
-
49
-
50
-
51
-
52
-
53
-
54
-
55
-
56
-
57
-
58
-
59
-
60
-
61
-
62
-
63
-
64
-
65
-
66
-
67
-
68
-
69
-
70
-
71
-
72
-
73
-
74
-
75
-
76
-
77
-
78
-
79
-
80
-
81
-
82
-
83
-
84
-
85
-
86
-
87
-
88
-
89
-
90
-
91
-
92
-
93
-
94
-
95
-
96
-
97
-
98
-
99
-
100
-
101
-
102
-
103
-
104
-
105
-
106
-
107
-
108
-
109
-
110
-
111
-
112
-
113
-
114
-
115
-
116
-
117
-
118
-
119
-
120
-
121
-
122
-
123
-
124
-
125
-
126
-
127
 |
 |

Management and
Corporate Information Investor Information
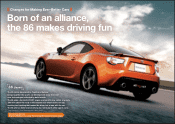
Changes for Making
Ever-Better Cars
Toyota Global Vision Business and
Performance Review Financial Section President
ʼ
s Message Medium- to Long-Term
Growth Initiatives Special Feature
TOYOTA ANNUAL REPORT 2012
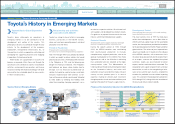
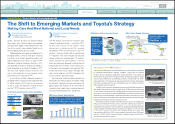
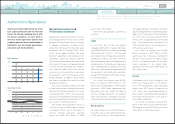
Special Feature: Toyota’
s Efforts in Emerging Markets
Toyota’
s emerging market sales ratio reached 45% in 2011, an increase of 10% in the three years
since we achieved 35% in 2008. The Toyota Global Vision calls for an emerging-market sales ratio
of 50% by 2015, and we are striving to hit this target ahead of schedule by strengthening our global
supply system in emerging markets and increasing localization, with Asia as an important base. In
addition, we will actively release compact vehicles specifically designed for emerging markets.
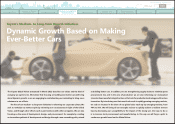
Aiming at Making Ever-Better Cars
through New Strategies
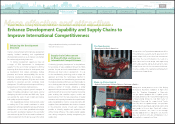
We will conduct business that is strongly rooted in the countries in which
we operate by adapting to local needs and pushing for 100% localization.
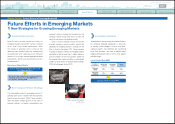
In 2011, emerging markets accounted for 45%
of Toyota’
s global vehicle sales
Thousands of units
Toyota Vehicle Sales
2000 2001 2002 2003 2004 2005 2006 2007 2008 2009 2010 2011
Global 5,154 5,262 5,519 6,070 6,708 7,268 7,922 8,429 7,996 6,980 7,528 7,097
Emerging
Markets 960 987 1,142 1,417 1,695 2,027 2,246 2,658 2,849 2,646 3,145 3,193
Composition
Ratio
18.6%18.8%20.7%23.3%25.3%27.9%28.4%31.5%35.6%37.9%41.8%45.0%
Search NextPrev page 16
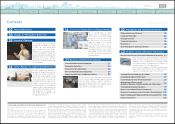
Contents
0821