Toyota 2012 Annual Report Download - page 81
Download and view the complete annual report
Please find page 81 of the 2012 Toyota annual report below. You can navigate through the pages in the report by either clicking on the pages listed below, or by using the keyword search tool below to find specific information within the annual report.-
 1
1 -
2
-
3
-
4
-
5
-
6
-
7
-
8
-
9
-
10
-
11
-
12
-
13
-
14
-
15
-
16
-
17
-
18
-
19
-
20
-
21
-
22
-
23
-
24
-
25
-
26
-
27
-
28
-
29
-
30
-
31
-
32
-
33
-
34
-
35
-
36
-
37
-
38
-
39
-
40
-
41
-
42
-
43
-
44
-
45
-
46
-
47
-
48
-
49
-
50
-
51
-
52
-
53
-
54
-
55
-
56
-
57
-
58
-
59
-
60
-
61
-
62
-
63
-
64
-
65
-
66
-
67
-
68
-
69
-
70
-
 71
71 -
 72
72 -
 73
73 -
 74
74 -
 75
75 -
 76
76 -
 77
77 -
 78
78 -
 79
79 -
 80
80 -
 81
81 -
 82
82 -
 83
83 -
 84
84 -
 85
85 -
 86
86 -
 87
87 -
 88
88 -
 89
89 -
 90
90 -
 91
91 -
92
-
93
-
94
-
95
-
96
-
97
-
98
-
99
-
100
-
101
-
102
-
103
-
104
-
105
-
106
-
107
-
108
-
109
-
110
-
111
-
112
-
113
-
114
-
115
-
116
-
117
-
118
-
119
-
120
-
121
-
122
-
123
-
124
-
125
-
126
-
127
 |
 |

TOYOTA ANNUAL REPORT 2012
Toyota Global Vision Changes for Making
Ever-Better Cars President
ʼ
s Message Medium- to Long-Term
Growth Initiatives Special Feature Management and
Corporate Information Investor Information
Business and
Performance Review Financial Section
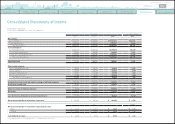
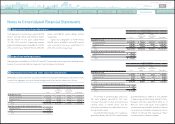
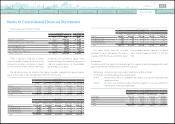
Consolidated Statements of Cash Flows
Toyota Motor Corporation
For the years ended March 31, 2010, 2011 and 2012
Yen in millions
U.S. dollars in millions
2010 2011 2012 2012
Cash flows from operating activities
Net income ¥ 244,212 ¥ 465,485 ¥ 368,302 $ 4,481
Adjustments to reconcile net income to net
cash provided by operating activities
Depreciation 1,414,569 1,175,573 1,067,830 12,992
Provision for doubtful accounts and credit
losses 100,775 4,140 9,623 117
Pension and severance costs, less
payments 1,254
(
23,414
)
16,711 203
Losses on disposal of fixed assets 46,937 36,214 33,528 408
Unrealized losses on available-for-sale
securities, net 2,486 7,915 53,831 655
Deferred income taxes 25,537 85,710 6,395 78
Equity in earnings of affiliated companies
(
45,408
) (
215,016
)(
197,701
) (
2,405
)
Changes in operating assets and liabilities,
and other
(
Increase
)
decrease in accounts and notes
receivable
(
576,711
)
421,423
(
585,464
) (
7,123
)
(
Increase
)
decrease in inventories 56,059 51,808
(
344,923
) (
4,197
)
(
Increase
)
decrease in other current
assets 97,494 38,307
(
180,529
) (
2,196
)
Increase
(
decrease
)
in accounts payable 649,214
(
406,210
)
756,363 9,203
Increase
(
decrease
)
in accrued income
taxes
102,207
(
40,629
)
20,943 255
Increase in other current liabilities 213,341 239,319 316,366 3,849
Other 226,564 183,384 111,160 1,352
Net cash provided by operating activities
¥ 2,558,530 ¥ 2,024,009 ¥ 1,452,435 $ 17,672
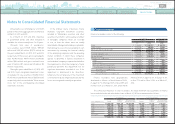
Yen in millions
U.S. dollars in millions
2010 2011 2012 2012
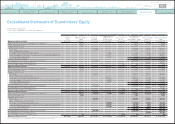
Cash flows from investing activities
Additions to finance receivables ¥
(
7,806,201
)
¥
(
8,438,785
)
¥
(
8,333,248
)
$
(
101,390
)
Collection of finance receivables 7,509,578 7,934,364 8,007,711 97,429
Proceeds from sales of finance receivables 8,390 69,576 53,999 657
Additions to fixed assets excluding equipment
leased to others
(
604,536
) (
629,326
)(
723,537
) (
8,803
)
Additions to equipment leased to others
(
833,065
) (
1,061,865
)(
808,545
) (
9,838
)
Proceeds from sales of fixed assets excluding
equipment leased to others 52,473 51,342 36,633 446
Proceeds from sales of equipment leased to
others 465,092 486,695 431,313 5,248
Purchases of marketable securities and
security investments
(
2,412,182
) (
4,421,807
)(
3,173,634
) (
38,614
)
Proceeds from sales of marketable securities
and security investments 77,025 189,037 162,160 1,973
Proceeds upon maturity of marketable
securities and security investments 1,031,716 3,527,119 2,694,665 32,786
Payment for additional investments in
affiliated companies, net of cash acquired
(
1,020
) (
299
)(
147
) (
2
)
Changes in investments and other assets,
and other
(
337,454
)
177,605 209,972 2,555
Net cash used in investing activities ¥
(
2,850,184
)
¥
(
2,116,344
)
¥
(
1,442,658
)
$
(
17,553
)
Cash flows from financing activities
Proceeds from issuance of long-term debt ¥ 3,178,310 ¥ 2,931,436 ¥ 2,394,807 $ 29,138
Payments of long-term debt
(
2,938,202
) (
2,489,632
)(
2,867,572
) (
34,889
)
Increase
(
decrease
)
in short-term borrowings
(
335,363
)
162,260 311,651 3,792
Dividends paid
(
172,476
) (
141,120
)(
156,785
) (
1,908
)
Purchase of common stock, and other
(
10,251
) (
28,617
)(
37,448
) (
456
)
Net cash provided by
(
used in
)
financing
activities
(
277,982
)
434,327
(
355,347
) (
4,323
)
Effect of exchange rate changes on cash and
cash equivalents
(
8,898
) (
127,029
)(
55,939
) (
681
)
Net increase
(
decrease
)
in cash and cash
equivalents
(
578,534
)
214,963
(
401,509
) (
4,885
)
Cash and cash equivalents at beginning of year 2,444,280 1,865,746 2,080,709 25,316
Cash and cash equivalents at end of year ¥ 1,865,746 ¥ 2,080,709 ¥ 1,679,200 $ 20,431
The accompanying notes are an integral part of these consolidated financial statements.
0820
Search NextPrev page 81
Contents