Toyota 2012 Annual Report Download - page 115
Download and view the complete annual report
Please find page 115 of the 2012 Toyota annual report below. You can navigate through the pages in the report by either clicking on the pages listed below, or by using the keyword search tool below to find specific information within the annual report.-
 1
1 -
2
-
3
-
4
-
5
-
6
-
7
-
8
-
9
-
10
-
11
-
12
-
13
-
14
-
15
-
16
-
17
-
18
-
19
-
20
-
21
-
22
-
23
-
24
-
25
-
26
-
27
-
28
-
29
-
30
-
31
-
32
-
33
-
34
-
35
-
36
-
37
-
38
-
39
-
40
-
41
-
42
-
43
-
44
-
45
-
46
-
47
-
48
-
49
-
50
-
51
-
52
-
53
-
54
-
55
-
56
-
57
-
58
-
59
-
60
-
61
-
62
-
63
-
64
-
65
-
66
-
67
-
68
-
69
-
70
-
71
-
72
-
73
-
74
-
75
-
76
-
77
-
78
-
79
-
80
-
81
-
82
-
83
-
84
-
85
-
86
-
87
-
88
-
89
-
90
-
91
-
92
-
93
-
94
-
95
-
96
-
97
-
98
-
99
-
100
-
101
-
102
-
103
-
104
-
 105
105 -
 106
106 -
 107
107 -
 108
108 -
 109
109 -
 110
110 -
 111
111 -
 112
112 -
 113
113 -
 114
114 -
 115
115 -
 116
116 -
 117
117 -
 118
118 -
 119
119 -
 120
120 -
 121
121 -
 122
122 -
 123
123 -
 124
124 -
 125
125 -
126
-
127
 |
 |
TOYOTA ANNUAL REPORT 2012
Toyota Global Vision Changes for Making
Ever-Better Cars President
ʼ
s Message Medium- to Long-Term
Growth Initiatives Special Feature Management and
Corporate Information Investor Information
Business and
Performance Review Financial Section
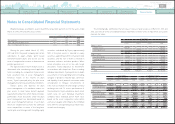
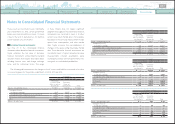
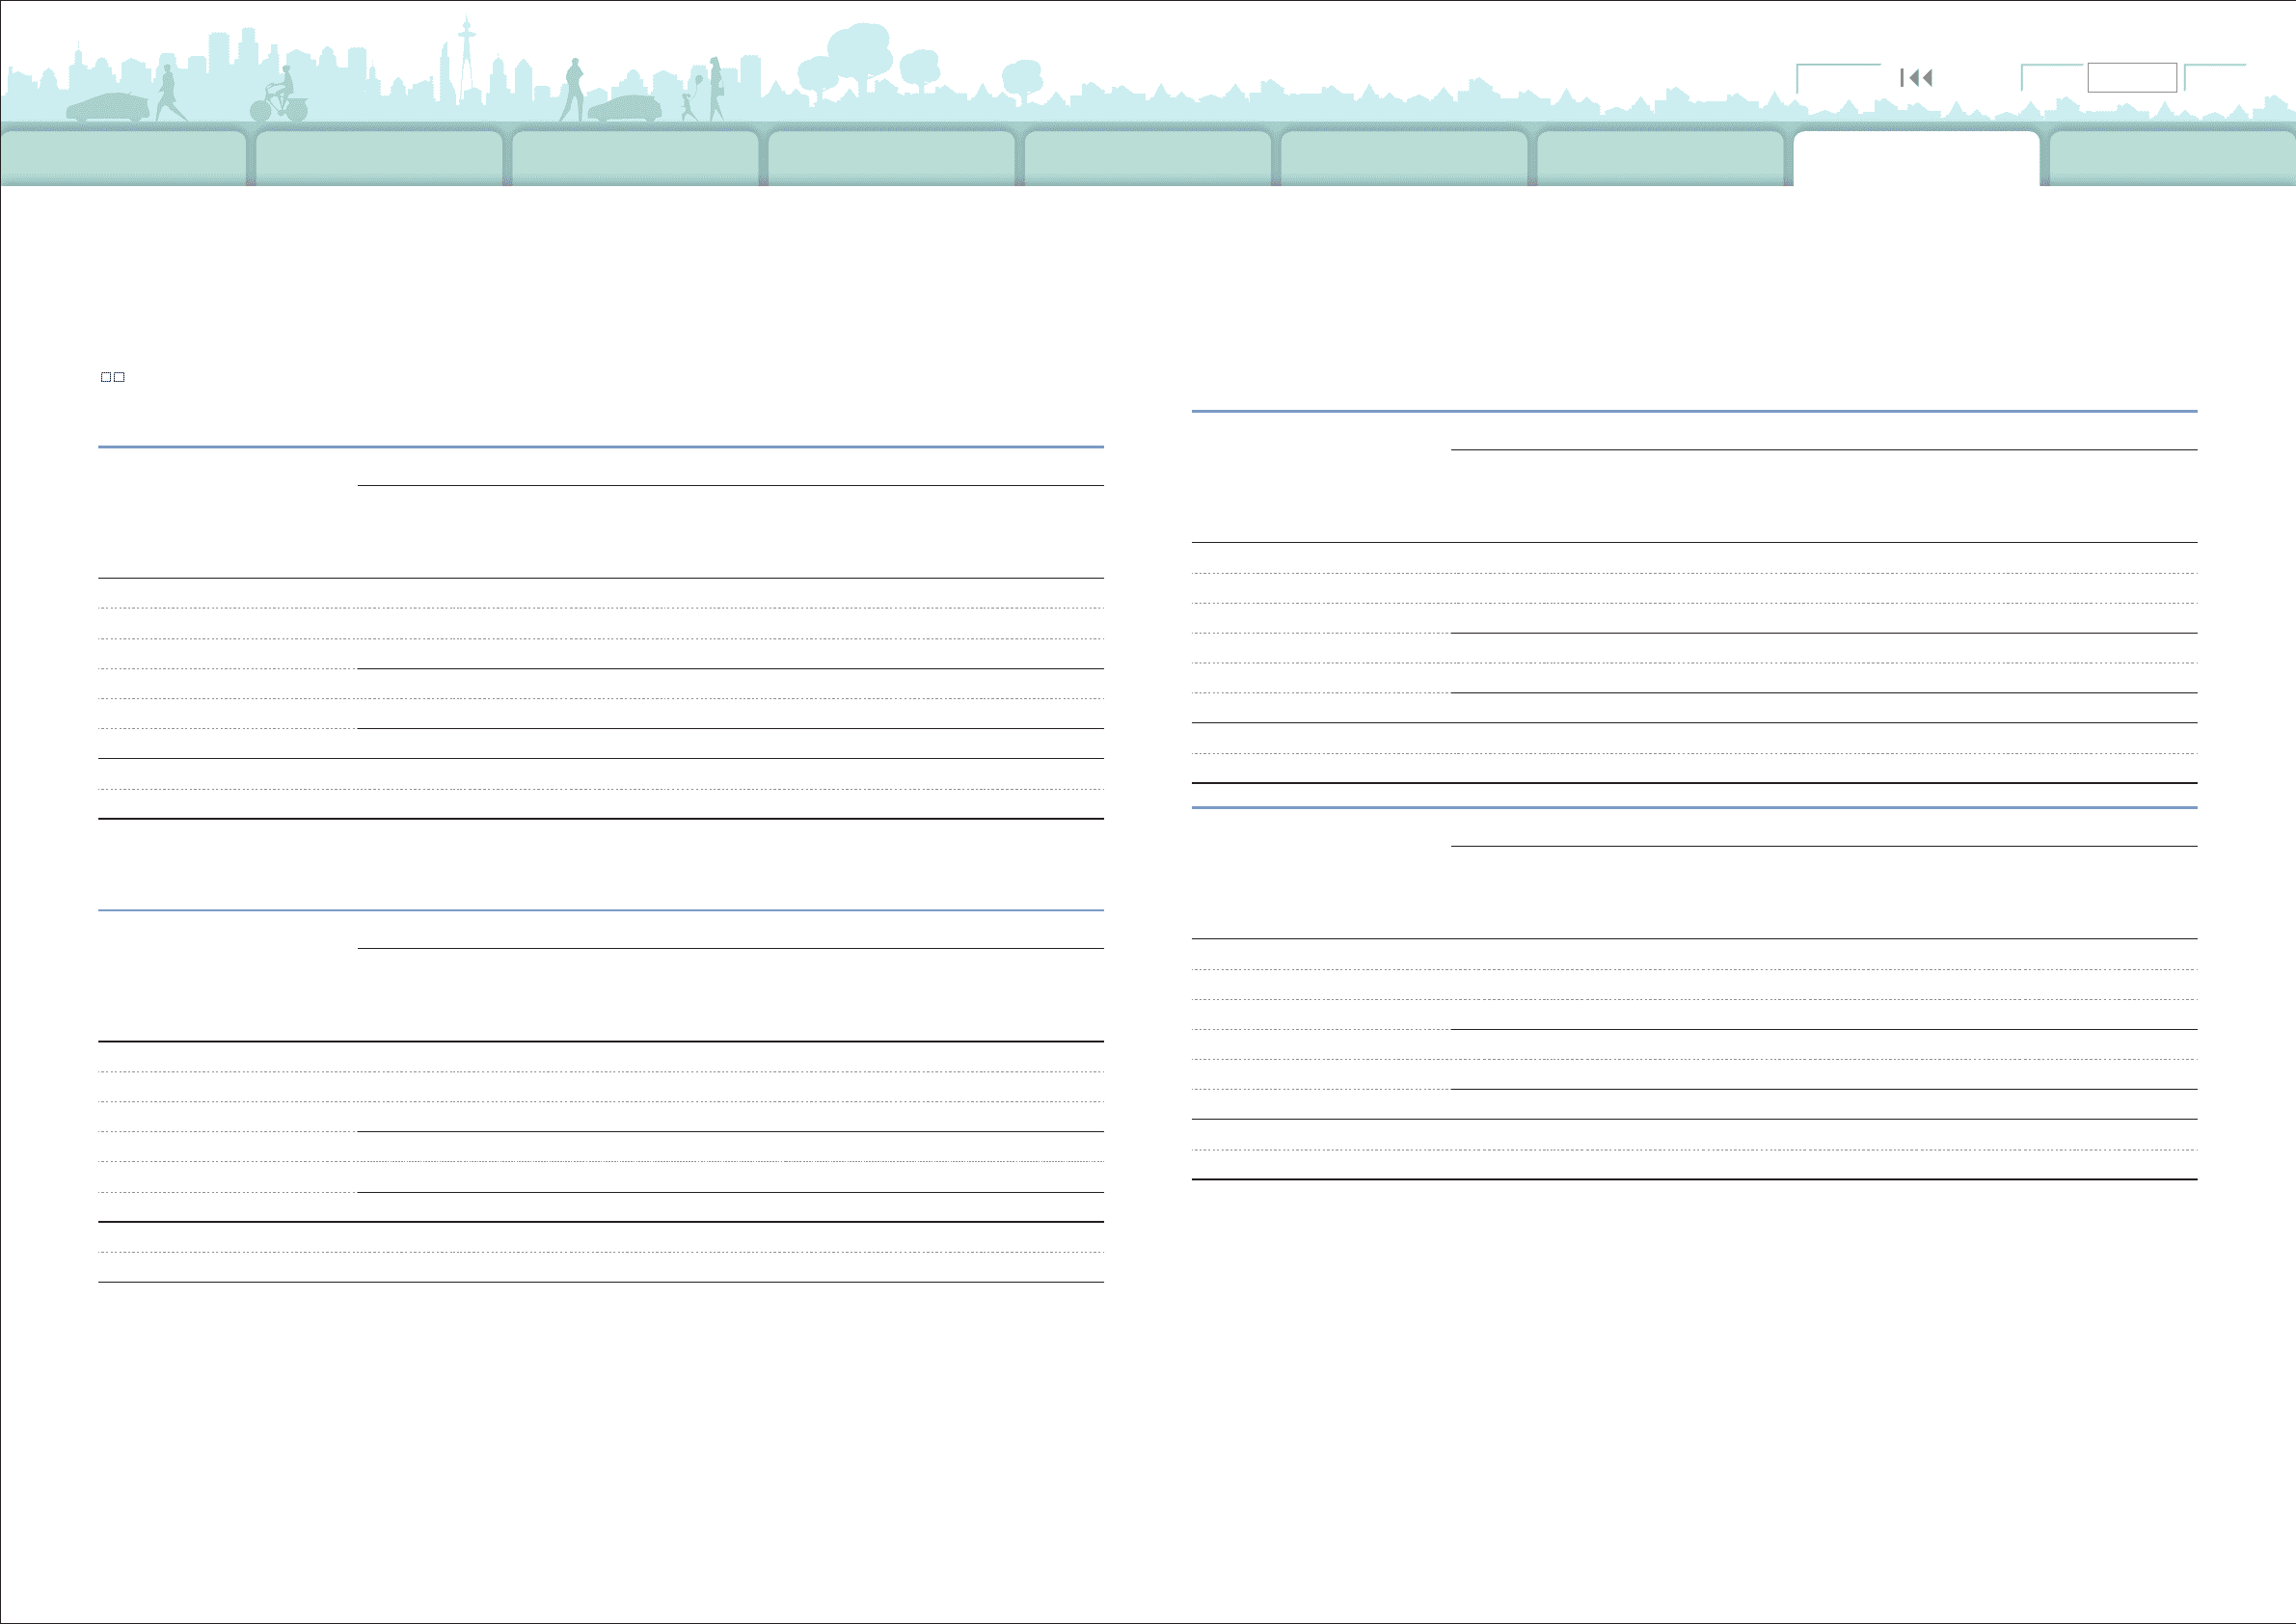
Notes to Consolidated Financial Statements
■
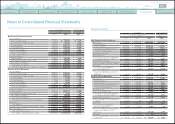
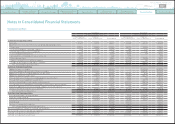
Geographic Information
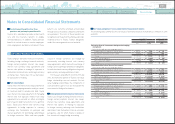
As of and for the year ended March 31, 2010:
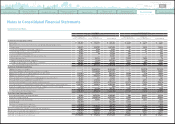
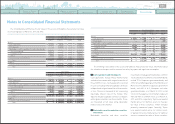
As of and for the year ended March 31, 2012:
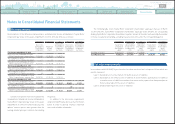
As of and for the year ended March 31, 2011:
Yen in millions
Japan North
America Europe Asia Other
Inter-segment
Elimination/
Unallocated
Amount
Consolidated
Net revenues
Sales to external customers
¥ 7,314,813 ¥ 5,583,228 ¥ 2,082,671 ¥ 2,431,648 ¥ 1,538,613 ¥
—
¥ 18,950,973
Inter-segment sales and transfers
3,905,490 87,298 64,378 223,679 135,248
(
4,416,093
)—
Total
11,220,303 5,670,526 2,147,049 2,655,327 1,673,861
(
4,416,093
)
18,950,973
Operating expenses
11,445,545 5,585,036 2,180,004 2,451,800 1,558,287
(
4,417,215
)
18,803,457
Operating income
(
loss
)
¥
(
225,242
)
¥ 85,490 ¥
(
32,955
)
¥ 203,527 ¥ 115,574 ¥ 1,122 ¥ 147,516
Assets
¥12,465,677 ¥10,223,903 ¥ 2,060,962 ¥1,925,126 ¥ 1,803,703 ¥ 1,869,916 ¥ 30,349,287
Long-lived assets
3,347,896 2,401,172 351,037 361,296 249,500
—
6,710,901
Yen in millions
Japan North
America Europe Asia Other
Inter-segment
Elimination/
Unallocated
Amount
Consolidated
Net revenues
Sales to external customers
¥ 7,293,804 ¥ 4,644,348 ¥1,917,408 ¥3,116,849 ¥1,611,244 ¥
̶
¥ 18,583,653
Inter-segment sales and transfers
3,873,515 107,538 76,538 217,425 148,931
(
4,423,947
)̶
Total
11,167,319 4,751,886 1,993,946 3,334,274 1,760,175
(
4,423,947
)
18,583,653
Operating expenses
11,374,359 4,565,477 1,976,150 3,077,484 1,651,361
(
4,416,805
)
18,228,026
Operating income
(
loss
)
¥
(
207,040
)
¥ 186,409 ¥ 17,796 ¥ 256,790 ¥ 108,814 ¥
(
7,142
)
¥ 355,627
Assets
¥12,034,423 ¥ 9,693,232 ¥1,960,532 ¥2,433,312 ¥2,175,493 ¥ 2,353,973 ¥ 30,650,965
Long-lived assets
2,981,985 2,197,197 263,070 412,959 380,169
̶
6,235,380
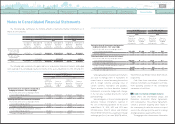
U.S. dollars in millions
Japan North
America Europe Asia Other
Inter-segment
Elimination/
Unallocated
Amount
Consolidated
Net revenues
Sales to external customers
$ 88,743 $ 56,507 $23,329 $ 37,923 $ 19,604 $
̶
$ 226,106
Inter-segment sales and transfers
47,129 1,309 931 2,645 1,812
(
53,826
)̶
Total
135,872 57,816 24,260 40,568 21,416
(
53,826
)
226,106
Operating expenses
138,391 55,548 24,043 37,444 20,092
(
53,739
)
221,779
Operating income
(
loss
)
$
(
2,519
)
$ 2,268 $ 217 $ 3,124 $ 1,324 $
(
87
)
$ 4,327
Assets
$146,422 $ 117,937 $23,854 $ 29,606 $ 26,469 $ 28,640 $ 372,928
Long-lived assets
36,282 26,733 3,201 5,024 4,625
̶
75,865
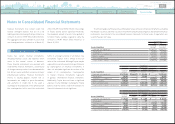
Yen in millions
Japan North
America Europe Asia Other
Inter-segment
Elimination/
Unallocated
Amount
Consolidated
Net revenues
Sales to external customers
¥ 6,966,929 ¥5,327,809 ¥1,920,416 ¥3,138,112 ¥ 1,640,422 ¥
—
¥ 18,993,688
Inter-segment sales and transfers
4,019,317 101,327 61,081 236,422 168,694
(
4,586,841
)—
Total
10,986,246 5,429,136 1,981,497 3,374,534 1,809,116
(
4,586,841
)
18,993,688
Operating expenses
11,348,642 5,089,633 1,968,349 3,061,557 1,648,987
(
4,591,759
)
18,525,409
Operating income
(
loss
)
¥
(
362,396
)
¥ 339,503 ¥ 13,148 ¥ 312,977 ¥ 160,129 ¥ 4,918 ¥ 468,279
Assets
¥11,285,864 ¥ 9,910,828 ¥ 1,931,231 ¥2,138,499 ¥ 2,044,379 ¥ 2,507,365 ¥ 29,818,166
Long-lived assets
3,123,042 2,276,332 305,627 344,304 259,855
—
6,309,160
Revenues are attributed to geographies based
on the country location of the parent company or
the subsidiary that transacted the sale with the
external customer.
There are no any individually material
countries with respect to revenues, and long-lived
assets included in other foreign countries.
Unallocated amounts included in assets
represent assets held for corporate purposes,
which mainly consist of cash and cash equivalents
and marketable securities. Such corporate assets
were ¥4,205,402 million, ¥4,613,672 million and
¥4,749,259 million
(
$57,784 million
)
, as of March
31, 2010, 2011 and 2012, respectively.
Transfers between industries or geographic
segments are made at amounts which Toyota
ʼ
s
“
Other
”
consists of Central and South America, Oceania and Africa.
0820
Search NextPrev page 115
Contents