Toyota 2012 Annual Report Download - page 43
Download and view the complete annual report
Please find page 43 of the 2012 Toyota annual report below. You can navigate through the pages in the report by either clicking on the pages listed below, or by using the keyword search tool below to find specific information within the annual report.-
 1
1 -
2
-
3
-
4
-
5
-
6
-
7
-
8
-
9
-
10
-
11
-
12
-
13
-
14
-
15
-
16
-
17
-
18
-
19
-
20
-
21
-
22
-
23
-
24
-
25
-
26
-
27
-
28
-
29
-
30
-
31
-
32
-
 33
33 -
 34
34 -
 35
35 -
 36
36 -
 37
37 -
 38
38 -
 39
39 -
 40
40 -
 41
41 -
 42
42 -
 43
43 -
 44
44 -
 45
45 -
 46
46 -
 47
47 -
 48
48 -
 49
49 -
 50
50 -
 51
51 -
 52
52 -
 53
53 -
54
-
55
-
56
-
57
-
58
-
59
-
60
-
61
-
62
-
63
-
64
-
65
-
66
-
67
-
68
-
69
-
70
-
71
-
72
-
73
-
74
-
75
-
76
-
77
-
78
-
79
-
80
-
81
-
82
-
83
-
84
-
85
-
86
-
87
-
88
-
89
-
90
-
91
-
92
-
93
-
94
-
95
-
96
-
97
-
98
-
99
-
100
-
101
-
102
-
103
-
104
-
105
-
106
-
107
-
108
-
109
-
110
-
111
-
112
-
113
-
114
-
115
-
116
-
117
-
118
-
119
-
120
-
121
-
122
-
123
-
124
-
125
-
126
-
127
 |
 |

TOYOTA ANNUAL REPORT 2012
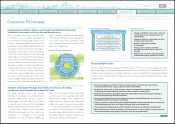
Toyota Global Vision Changes for Making
Ever-Better Cars President
ʼ
s Message Medium- to Long-Term
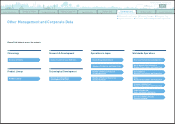
Growth Initiatives Special Feature Management and
Corporate Information Investor Information
Business and
Performance Review Financial Section
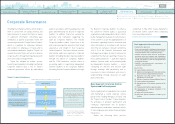
We will continue to implement profit improvement activities and aim to
develop a strong earnings base that can handle environmental changes.
Message from the Executive Vice President Responsible for Accounting
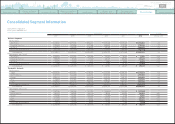
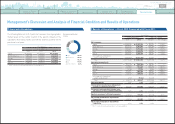
For the fiscal year ending March 31, 2013, we forecast vehicle sales of 8.7 million
units, net revenues of ¥22 trillion, operating income of ¥1 trillion and net income
of ¥760.0 billion on a consolidated basis. The exchange rates assumed for this
forecast are ¥80 per US$1 and ¥105 per €1.
Factors that are expected to increase income include marketing efforts
amounting to ¥550.0 billion and cost-reduction efforts amounting to ¥240.0
billion. Factors that are expected to decrease income include an increase in
expenses, etc., reaching ¥145.6 billion. With regard to marketing efforts, we
expect a significant increase, particularly in North America and Asia, as we
recover from the supply shortage in the last fiscal year.
In fiscal 2013, we are aiming to achieve operating income of ¥1 trillion
by actively promoting vehicle sales utilizing our new products as well as our
competitive lineup of hybrid vehicles and IMVs etc., and strongly pursuing cost
reduction together with our suppliers.
We have been aiming to establish a cycle of developing
“
better cars
”
that
are accepted by our customers and society, and should increase sales and
consequently profits to reinvest in developing even
“
better cars.
”
This cycle is
supported by the strong earnings base described in Toyota Global Vision. We
believe that the results of our efforts to develop
“
better cars
”
will be evident
in our numbers in fiscal 2013, and our business foundation is now steadily
improving towards the earnings structure described in Toyota Global Vision.
We will continue to establish a cycle of developing
“
better cars
”
and aim to
build a strong earnings base that can handle environmental changes such as
fluctuations in exchange rates and the number of vehicles sold, with further
marketing efforts and holding down fixed costs, thorough cost reductions,
localization of production and procurement, and similar efforts.
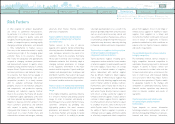
Consolidated Financial Forecasts for Fiscal 2013Fiscal 2012 Business Results
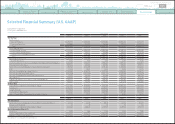
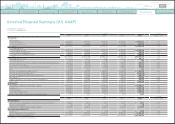
On a consolidated basis for the fiscal year ended March 31, 2012, year-on-year vehicle
sales improved 44 thousand units to 7.352 million units. However, net revenues
decreased 2.2% to ¥18,583.6 billion, operating income decreased ¥112.6 billion to
¥355.6 billion, and net income decreased ¥124.6 billion to ¥283.5 billion.
Factors contributing to the decrease in operating income included ¥250.0 billion due
to exchange rate fluctuations, ¥100.0 billion due to an increase in expenses including labor
cost, etc. and ¥62.6 billion due to other factors. Factors contributing to the increase in
operating income included ¥150.0 billion from marketing efforts and ¥150.0 billion from our
continuous cost-reduction efforts, including companywide VA
(
Value Analysis
)
activities.
The further appreciation of the Japanese yen against the U.S. dollar, the euro
and other currencies reduced the profitability of exports. And for marketing efforts,
although vehicle sales in North America decreased due mainly to a lack of vehicle
supply caused by the Great East Japan Earthquake in March 2011, vehicle sales in Japan
increased as in the second half, we experienced a strong recovery of lost opportunities
due to the Japan earthquake. And in Asia, although IMVs sales were particularly
affected by the supply disruption due to the Thailand floods, Etios sales in India were
strong, and as a result, sales marked a new record, and contributed to higher income.
The business environment in fiscal 2012 was extremely challenging due to losses
in production following the Japan earthquake and the Thailand floods, in addition
to yen appreciation. Nevertheless, we achieved operating income of ¥355.6 billion
thanks to the concerted efforts of our employees, suppliers and dealers to recover
production and sales. Through the concerted efforts of the whole Toyota group to
implement cost reductions and fixed cost reductions, we made improvements to our
structure for developing a strong earnings base. Also, from fiscal 2013 onward, we
will make further improvements to our structure by continuing profit improvement
activities.
0820
Search NextPrev page 43
Contents