Toyota 2012 Annual Report Download - page 53
Download and view the complete annual report
Please find page 53 of the 2012 Toyota annual report below. You can navigate through the pages in the report by either clicking on the pages listed below, or by using the keyword search tool below to find specific information within the annual report.-
 1
1 -
2
-
3
-
4
-
5
-
6
-
7
-
8
-
9
-
10
-
11
-
12
-
13
-
14
-
15
-
16
-
17
-
18
-
19
-
20
-
21
-
22
-
23
-
24
-
25
-
26
-
27
-
28
-
29
-
30
-
31
-
32
-
33
-
34
-
35
-
36
-
37
-
38
-
39
-
40
-
41
-
42
-
 43
43 -
 44
44 -
 45
45 -
 46
46 -
 47
47 -
 48
48 -
 49
49 -
 50
50 -
 51
51 -
 52
52 -
 53
53 -
 54
54 -
 55
55 -
 56
56 -
 57
57 -
 58
58 -
 59
59 -
 60
60 -
 61
61 -
 62
62 -
 63
63 -
64
-
65
-
66
-
67
-
68
-
69
-
70
-
71
-
72
-
73
-
74
-
75
-
76
-
77
-
78
-
79
-
80
-
81
-
82
-
83
-
84
-
85
-
86
-
87
-
88
-
89
-
90
-
91
-
92
-
93
-
94
-
95
-
96
-
97
-
98
-
99
-
100
-
101
-
102
-
103
-
104
-
105
-
106
-
107
-
108
-
109
-
110
-
111
-
112
-
113
-
114
-
115
-
116
-
117
-
118
-
119
-
120
-
121
-
122
-
123
-
124
-
125
-
126
-
127
 |
 |
TOYOTA ANNUAL REPORT 2012
Toyota Global Vision Changes for Making
Ever-Better Cars President
ʼ
s Message Medium- to Long-Term
Growth Initiatives Special Feature Management and
Corporate Information Investor Information
Business and
Performance Review Financial Section
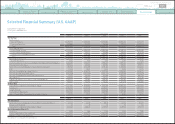
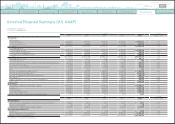
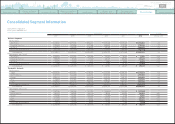
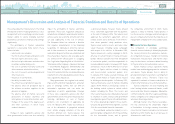
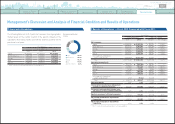
Management's Discussion and Analysis of Financial Condition and Results of Operations
The following table sets forth Toyota
ʼ
s net revenues in each geographic
market based on the country location of the parent company or the
subsidiaries that transacted the sale with the external customer for the
past three fiscal years.
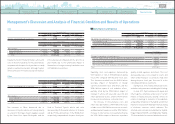
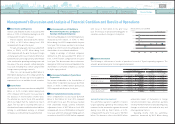
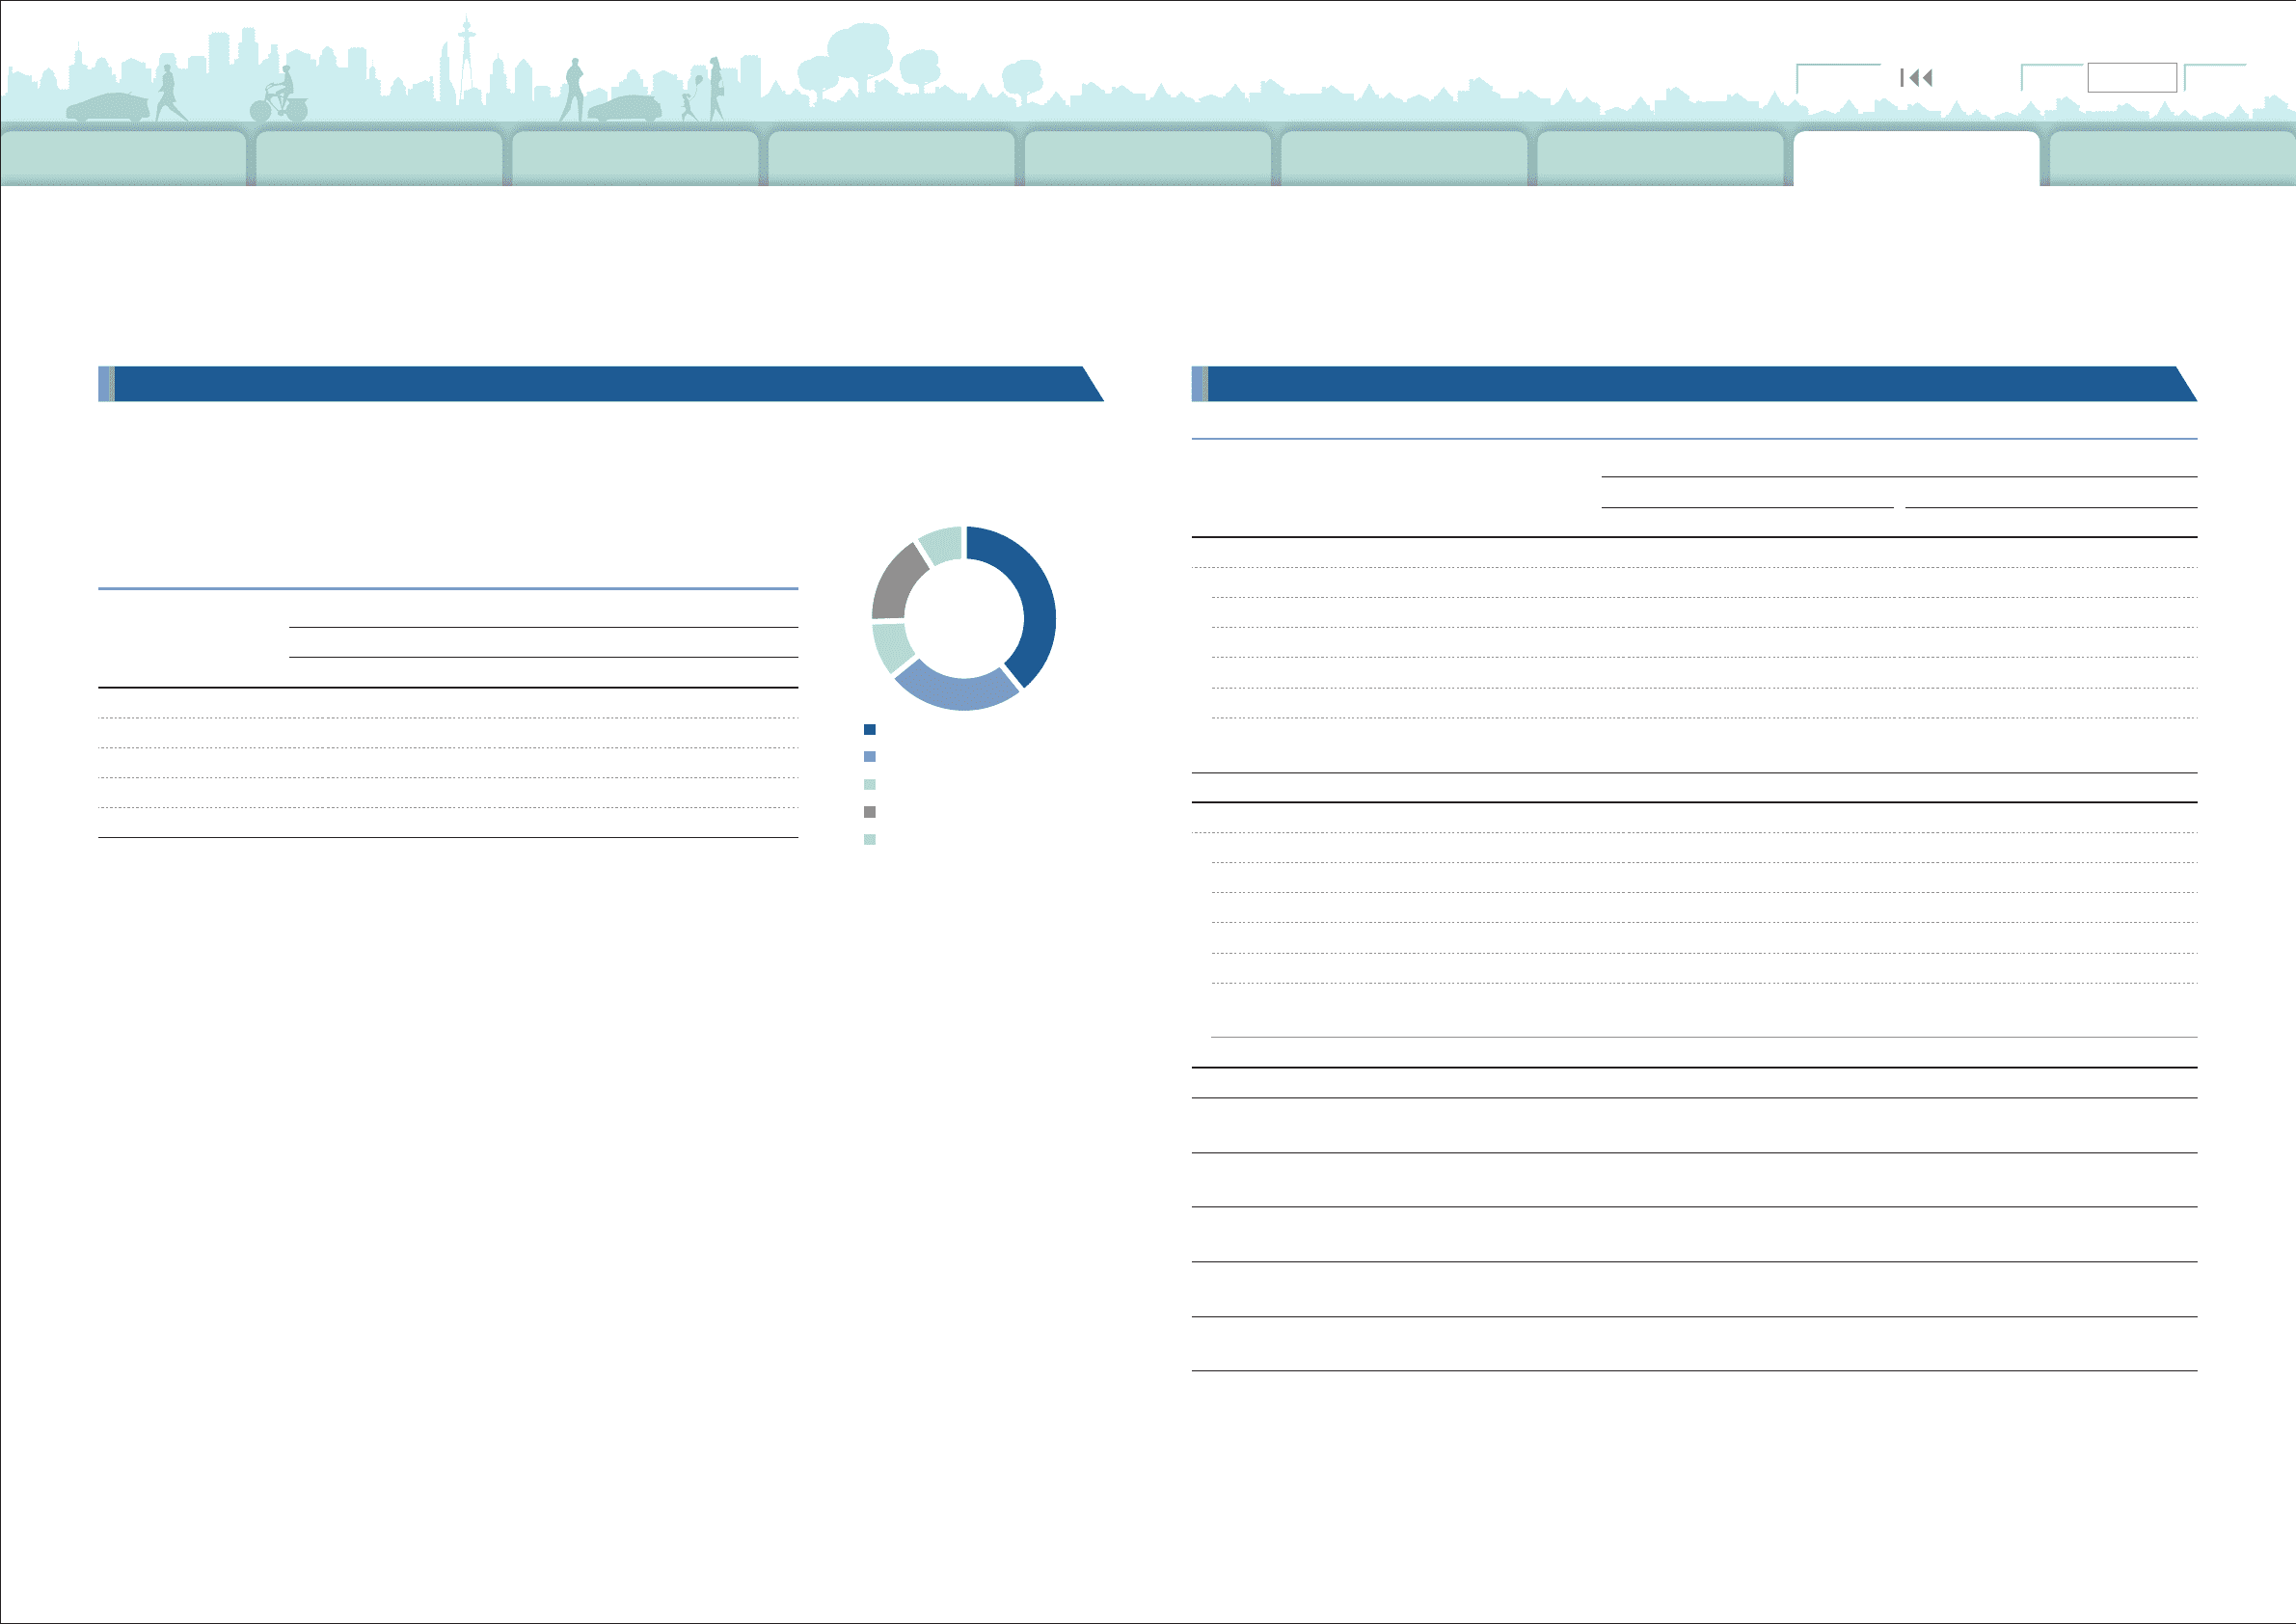
Geographic Breakdown Results of Operations
̶
Fiscal 2012 Compared with Fiscal 2011
Japan 39.2%
North America 25.0%
Europe 10.3%
Asia 16.8%
All Other Markets 8.7%
*
“
Other
”
consists of Central and South America, Oceania and Africa.
*
“
Other
”
consists of Central and South America, Oceania and Africa.
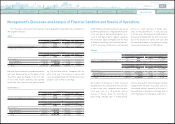
Revenues by Market
FY2012
Yen in millions
Year ended March 31,
2010 2011 2012
Japan ¥7,314,813 ¥6,966,929 ¥7,293,804
North America 5,583,228 5,327,809 4,644,348
Europe 2,082,671 1,920,416 1,917,408
Asia 2,431,648 3,138,112 3,116,849
Other* 1,538,613 1,640,422 1,611,244
Yen in millions
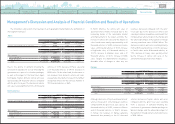
Year ended March 31, 2012 vs. 2011 Change
2011 2012 Amount Percentage
Net revenues:
Japan ¥ 10,986,246 ¥ 11,167,319 ¥ 181,073 +1.6%
North America 5,429,136 4,751,886
(
677,250
)
-
12.5%
Europe 1,981,497 1,993,946 12,449 +0.6%
Asia 3,374,534 3,334,274
(
40,260
)
-
1.2%
Other* 1,809,116 1,760,175
(
48,941
)
-
2.7%
Intersegment elimination/
unallocated amount
(
4,586,841
)(
4,423,947
)
162,894
—
Total ¥ 18,993,688 ¥ 18,583,653 ¥
(
410,035
)
-
2.2%
Operating income
(
loss
)
:
Japan ¥
(
362,396
)
¥
(
207,040
)
¥ 155,356
—
North America 339,503 186,409
(
153,094
)
-
45.1%
Europe 13,148 17,796 4,648 +35.4%
Asia 312,977 256,790
(
56,187
)
-
18.0%
Other* 160,129 108,814
(
51,315
)
-
32.0%
Intersegment elimination/
unallocated amount 4,918
(
7,142
)(
12,060
)—
Total ¥ 468,279 ¥ 355,627 ¥
(
112,652
)
-
24.1%
Operating margin 2.5% 1.9%
-
0.6%
Income before income taxes and equity in
earnings of affiliated companies 563,290 432,873
(
130,417
)
-
23.2%
Net margin from income before income taxes
and equity in earnings of affiliated companies
3.0% 2.3%
-
0.7%
Equity in earnings of affiliated companies 215,016 197,701
(
17,315
)
-
8.1%
Net income attributable to Toyota Motor
Corporation 408,183 283,559
(
124,624
)
-
30.5%
Net margin attributable to Toyota Motor
Corporation 2.1% 1.5%
-
0.6%
0820
Search NextPrev page 53
Contents