Toyota 2012 Annual Report Download - page 119
Download and view the complete annual report
Please find page 119 of the 2012 Toyota annual report below. You can navigate through the pages in the report by either clicking on the pages listed below, or by using the keyword search tool below to find specific information within the annual report.-
 1
1 -
2
-
3
-
4
-
5
-
6
-
7
-
8
-
9
-
10
-
11
-
12
-
13
-
14
-
15
-
16
-
17
-
18
-
19
-
20
-
21
-
22
-
23
-
24
-
25
-
26
-
27
-
28
-
29
-
30
-
31
-
32
-
33
-
34
-
35
-
36
-
37
-
38
-
39
-
40
-
41
-
42
-
43
-
44
-
45
-
46
-
47
-
48
-
49
-
50
-
51
-
52
-
53
-
54
-
55
-
56
-
57
-
58
-
59
-
60
-
61
-
62
-
63
-
64
-
65
-
66
-
67
-
68
-
69
-
70
-
71
-
72
-
73
-
74
-
75
-
76
-
77
-
78
-
79
-
80
-
81
-
82
-
83
-
84
-
85
-
86
-
87
-
88
-
89
-
90
-
91
-
92
-
93
-
94
-
95
-
96
-
97
-
98
-
99
-
100
-
101
-
102
-
103
-
104
-
105
-
106
-
107
-
108
-
 109
109 -
 110
110 -
 111
111 -
 112
112 -
 113
113 -
 114
114 -
 115
115 -
 116
116 -
 117
117 -
 118
118 -
 119
119 -
 120
120 -
 121
121 -
 122
122 -
 123
123 -
 124
124 -
 125
125 -
 126
126 -
 127
127
 |
 |

TOYOTA ANNUAL REPORT 2012
Toyota Global Vision Changes for Making
Ever-Better Cars President
ʼ
s Message Medium- to Long-Term
Growth Initiatives Special Feature Management and
Corporate Information Investor Information
Business and
Performance Review Financial Section
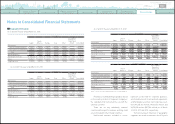
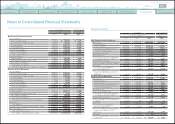
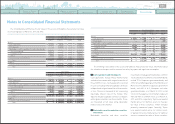
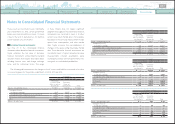
Notes to Consolidated Financial Statements
Yen in millions
U.S. dollars in millions
For the year ended March 31, 2012 For the year ended March 31, 2012
Non-Financial
Services Businesses Financial
Services Businesses Consolidated Non-Financial
Services Businesses Financial
Services Businesses Consolidated
Cash flows from operating activities
Net income ¥ 186,159 ¥ 182,191 ¥ 368,302 $ 2,265 $ 2,217 $ 4,481
Adjustments to reconcile net income to net cash provided by operating activities
Depreciation 769,073 298,757 1,067,830 9,357 3,635 12,992
Provision for doubtful accounts and credit losses 5,843 3,780 9,623 71 46 117
Pension and severance costs, less payments 15,410 1,301 16,711 187 16 203
Losses on disposal of fixed assets 33,448 80 33,528 407 1 408
Unrealized losses on available-for-sale securities, net 53,831
̶
53,831 655
̶
655
Deferred income taxes
(
82,792
)
89,199 6,395
(
1,007
)
1,085 78
Equity in earnings of affiliated companies
(
196,544
) (
1,157
) (
197,701
) (
2,391
) (
14
) (
2,405
)
Changes in operating assets and liabilities, and other 182,931
(
73,020
)
93,916 2,226
(
889
)
1,143
Net cash provided by operating activities 967,359 501,131 1,452,435 11,770 6,097 17,672
Cash flows from investing activities
Additions to finance receivables
̶
(
13,455,792
) (
8,333,248
)̶
(
163,715
) (
101,390
)
Collection of and proceeds from sales of finance receivables
̶
13,168,058 8,061,710
̶
160,215 98,086
Additions to fixed assets excluding equipment leased to others
(
713,867
) (
9,670
) (
723,537
) (
8,685
) (
118
) (
8,803
)
Additions to equipment leased to others
(
135,054
) (
673,491
) (
808,545
) (
1,644
) (
8,194
) (
9,838
)
Proceeds from sales of fixed assets excluding equipment leased to others 36,203 430 36,633 441 5 446
Proceeds from sales of equipment leased to others 20,689 410,624 431,313 252 4,996 5,248
Purchases of marketable securities and security investments
(
2,565,772
) (
607,862
) (
3,173,634
) (
31,218
) (
7,396
) (
38,614
)
Proceeds from sales of and maturity of marketable securities and security investments 2,227,812 629,013 2,856,825 27,106 7,653 34,759
Payment for additional investments in affiliated companies, net of cash acquired
(
147
)̶
(
147
) (
2
)̶
(
2
)
Changes in investments and other assets, and other 213,957
(
12,206
)
209,972 2,603
(
148
)
2,555
Net cash used in investing activities
(
916,179
) (
550,896
) (
1,442,658
) (
11,147
) (
6,702
) (
17,553
)
Cash flows from financing activities
Proceeds from issuance of long-term debt 39,803 2,379,152 2,394,807 484 28,947 29,138
Payments of long-term debt
(
294,646
) (
2,608,135
) (
2,867,572
) (
3,585
) (
31,733
) (
34,889
)
Increase in short-term borrowings 238,072 93,002 311,651 2,897 1,132 3,792
Dividends paid
(
156,785
)̶
(
156,785
) (
1,908
)̶
(
1,908
)
Purchase of common stock, and other
(
37,448
)̶
(
37,448
) (
456
)̶
(
456
)
Net cash used in financing activities
(
211,004
) (
135,981
) (
355,347
) (
2,568
) (
1,654
) (
4,323
)
Effect of exchange rate changes on cash and cash equivalents
(
36,093
) (
19,846
) (
55,939
) (
439
) (
242
) (
681
)
Net decrease in cash and cash equivalents
(
195,917
) (
205,592
) (
401,509
) (
2,384
) (
2,501
) (
4,885
)
Cash and cash equivalents at beginning of year 1,300,553 780,156 2,080,709 15,824 9,492 25,316
Cash and cash equivalents at end of year ¥ 1,104,636 ¥ 574,564 ¥ 1,679,200 $ 13,440 $ 6,991 $ 20,431
Statement of cash flows
0820
Search NextPrev page 119
Contents