Toyota 2012 Annual Report Download - page 89
Download and view the complete annual report
Please find page 89 of the 2012 Toyota annual report below. You can navigate through the pages in the report by either clicking on the pages listed below, or by using the keyword search tool below to find specific information within the annual report.-
 1
1 -
2
-
3
-
4
-
5
-
6
-
7
-
8
-
9
-
10
-
11
-
12
-
13
-
14
-
15
-
16
-
17
-
18
-
19
-
20
-
21
-
22
-
23
-
24
-
25
-
26
-
27
-
28
-
29
-
30
-
31
-
32
-
33
-
34
-
35
-
36
-
37
-
38
-
39
-
40
-
41
-
42
-
43
-
44
-
45
-
46
-
47
-
48
-
49
-
50
-
51
-
52
-
53
-
54
-
55
-
56
-
57
-
58
-
59
-
60
-
61
-
62
-
63
-
64
-
65
-
66
-
67
-
68
-
69
-
70
-
71
-
72
-
73
-
74
-
75
-
76
-
77
-
78
-
 79
79 -
 80
80 -
 81
81 -
 82
82 -
 83
83 -
 84
84 -
 85
85 -
 86
86 -
 87
87 -
 88
88 -
 89
89 -
 90
90 -
 91
91 -
 92
92 -
 93
93 -
 94
94 -
 95
95 -
 96
96 -
 97
97 -
 98
98 -
 99
99 -
100
-
101
-
102
-
103
-
104
-
105
-
106
-
107
-
108
-
109
-
110
-
111
-
112
-
113
-
114
-
115
-
116
-
117
-
118
-
119
-
120
-
121
-
122
-
123
-
124
-
125
-
126
-
127
 |
 |

TOYOTA ANNUAL REPORT 2012
Toyota Global Vision Changes for Making
Ever-Better Cars President
ʼ
s Message Medium- to Long-Term
Growth Initiatives Special Feature Management and
Corporate Information Investor Information
Business and
Performance Review Financial Section
Notes to Consolidated Financial Statements
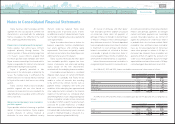
In the ordinary course of business, Toyota
maintains long-term investment securities,
included in
“
Marketable securities and other
securities investments
”
and issued by a number
of non-public companies which are recorded
at cost, as their fair values were not readily
determinable. Management employs a systematic
methodology to assess the recoverability of such
investments by reviewing the financial viability
of the underlying companies and the prevailing
market conditions in which these companies
operate to determine if Toyota
ʼ
s investment in
each individual company is impaired and whether
the impairment is other-than-temporary. Toyota
periodically performs this impairment test for
significant investments recorded at cost. If the
impairment is determined to be other-than-
temporary, the carrying value of the investment
is written-down by the impaired amount and the
losses are recognized currently in operations.
America 58.1%, in Japan 12.0%, in Europe 10.3%,
in Asia 7.1% and in Other 12.5% as of March 31,
2012.
Unrealized losses continuing over a 12 month
period or more in the aggregate were not material
at March 31, 2011 and 2012.
As of March 31, 2011 and 2012, maturities
of government bonds and other included in
available-for-sale are mainly from 1 to 10 years.
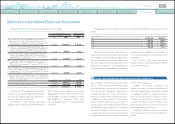
Proceeds from sales of available-for-
sale securities were ¥77,025 million, ¥189,037
million and ¥162,160 million
(
$1,973 million
)
for
the years ended March 31, 2010, 2011 and 2012,
respectively. On those sales, gross realized gains
were ¥3,186 million, ¥8,974 million and ¥4,822
million
(
$59 million
)
and gross realized losses
were ¥7 million, ¥87 million and ¥15 million
(
$0
million
)
, respectively.
During the years ended March 31, 2010, 2011
and 2012, Toyota recognized impairment losses
on available-for-sale securities of ¥2,486 million,
¥7,915 million and ¥53,831 million
(
$655 million
)
,
respectively, which are included in
“
Other income
(
loss
)
, net
”
in the accompanying consolidated
statements of income.
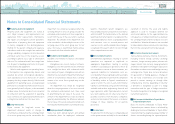
Finance receivables were geographically
distributed as follows: in North America 59.0%,
in Japan 12.7%, in Europe 10.4%, in Asia 5.8% and
in Other 12.1% as of March 31, 2011, and in North
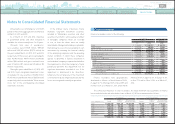
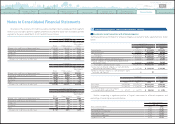
Finance receivables: 7
Finance receivables consist of the following:
Yen in millions
U.S. dollars in millions
March 31, March 31,
2011 2012 2012
Retail ¥ 7,128,453 ¥ 7,248,793 $ 88,195
Finance leases 1,123,188 955,430 11,625
Wholesale and other dealer loans 1,990,557 2,033,954 24,747
10,242,198 10,238,177 124,567
Deferred origination costs 104,391 105,533 1,284
Unearned income
(
496,235
)(
494,123
) (
6,012
)
Allowance for credit losses
Retail
(
92,199
)(
77,353
) (
941
)
Finance leases
(
36,024
)(
30,637
) (
373
)
Wholesale and other dealer loans
(
28,580
)(
24,238
) (
295
)
Total allowance for credit losses
(
156,803
)(
132,228
) (
1,609
)
Total finance receivables, net 9,693,551 9,717,359 118,230
Less - Current portion
(
4,136,805
)(
4,114,897
) (
50,065
)
Noncurrent finance receivables, net ¥ 5,556,746 ¥ 5,602,462 $ 68,165
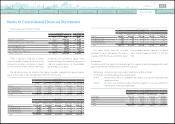
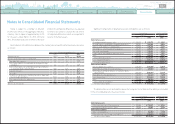
The contractual maturities of retail receivables, the future minimum lease payments on finance
leases and wholesale and other dealer loans at March 31, 2012 are summarized as follows:
Yen in millions
U.S. dollars in millions
Years ending March 31, Retail Finance
leases
Wholesale and
other dealer loans
Retail Finance
leases
Wholesale and
other dealer loans
2013 ¥ 2,528,895 ¥ 276,630 ¥ 1,490,687 $ 30,769 $ 3,366 $ 18,137
2014 1,774,195 182,404 209,151 21,586 2,219 2,545
2015 1,380,910 117,854 78,369 16,802 1,434 953
2016 881,267 80,239 71,637 10,722 976 872
2017 427,490 19,546 98,111 5,201 238 1,194
Thereafter 256,036 11,969 85,999 3,115 146 1,046
¥ 7,248,793 ¥ 688,642 ¥ 2,033,954 $ 88,195 $ 8,379 $ 24,747
0820
Search NextPrev page 89
Contents