Toyota 2012 Annual Report Download - page 94
Download and view the complete annual report
Please find page 94 of the 2012 Toyota annual report below. You can navigate through the pages in the report by either clicking on the pages listed below, or by using the keyword search tool below to find specific information within the annual report.-
 1
1 -
2
-
3
-
4
-
5
-
6
-
7
-
8
-
9
-
10
-
11
-
12
-
13
-
14
-
15
-
16
-
17
-
18
-
19
-
20
-
21
-
22
-
23
-
24
-
25
-
26
-
27
-
28
-
29
-
30
-
31
-
32
-
33
-
34
-
35
-
36
-
37
-
38
-
39
-
40
-
41
-
42
-
43
-
44
-
45
-
46
-
47
-
48
-
49
-
50
-
51
-
52
-
53
-
54
-
55
-
56
-
57
-
58
-
59
-
60
-
61
-
62
-
63
-
64
-
65
-
66
-
67
-
68
-
69
-
70
-
71
-
72
-
73
-
74
-
75
-
76
-
77
-
78
-
79
-
80
-
81
-
82
-
83
-
 84
84 -
 85
85 -
 86
86 -
 87
87 -
 88
88 -
 89
89 -
 90
90 -
 91
91 -
 92
92 -
 93
93 -
 94
94 -
 95
95 -
 96
96 -
 97
97 -
 98
98 -
 99
99 -
 100
100 -
 101
101 -
 102
102 -
 103
103 -
 104
104 -
105
-
106
-
107
-
108
-
109
-
110
-
111
-
112
-
113
-
114
-
115
-
116
-
117
-
118
-
119
-
120
-
121
-
122
-
123
-
124
-
125
-
126
-
127
 |
 |
TOYOTA ANNUAL REPORT 2012
Toyota Global Vision Changes for Making
Ever-Better Cars President
ʼ
s Message Medium- to Long-Term
Growth Initiatives Special Feature Management and
Corporate Information Investor Information
Business and
Performance Review Financial Section
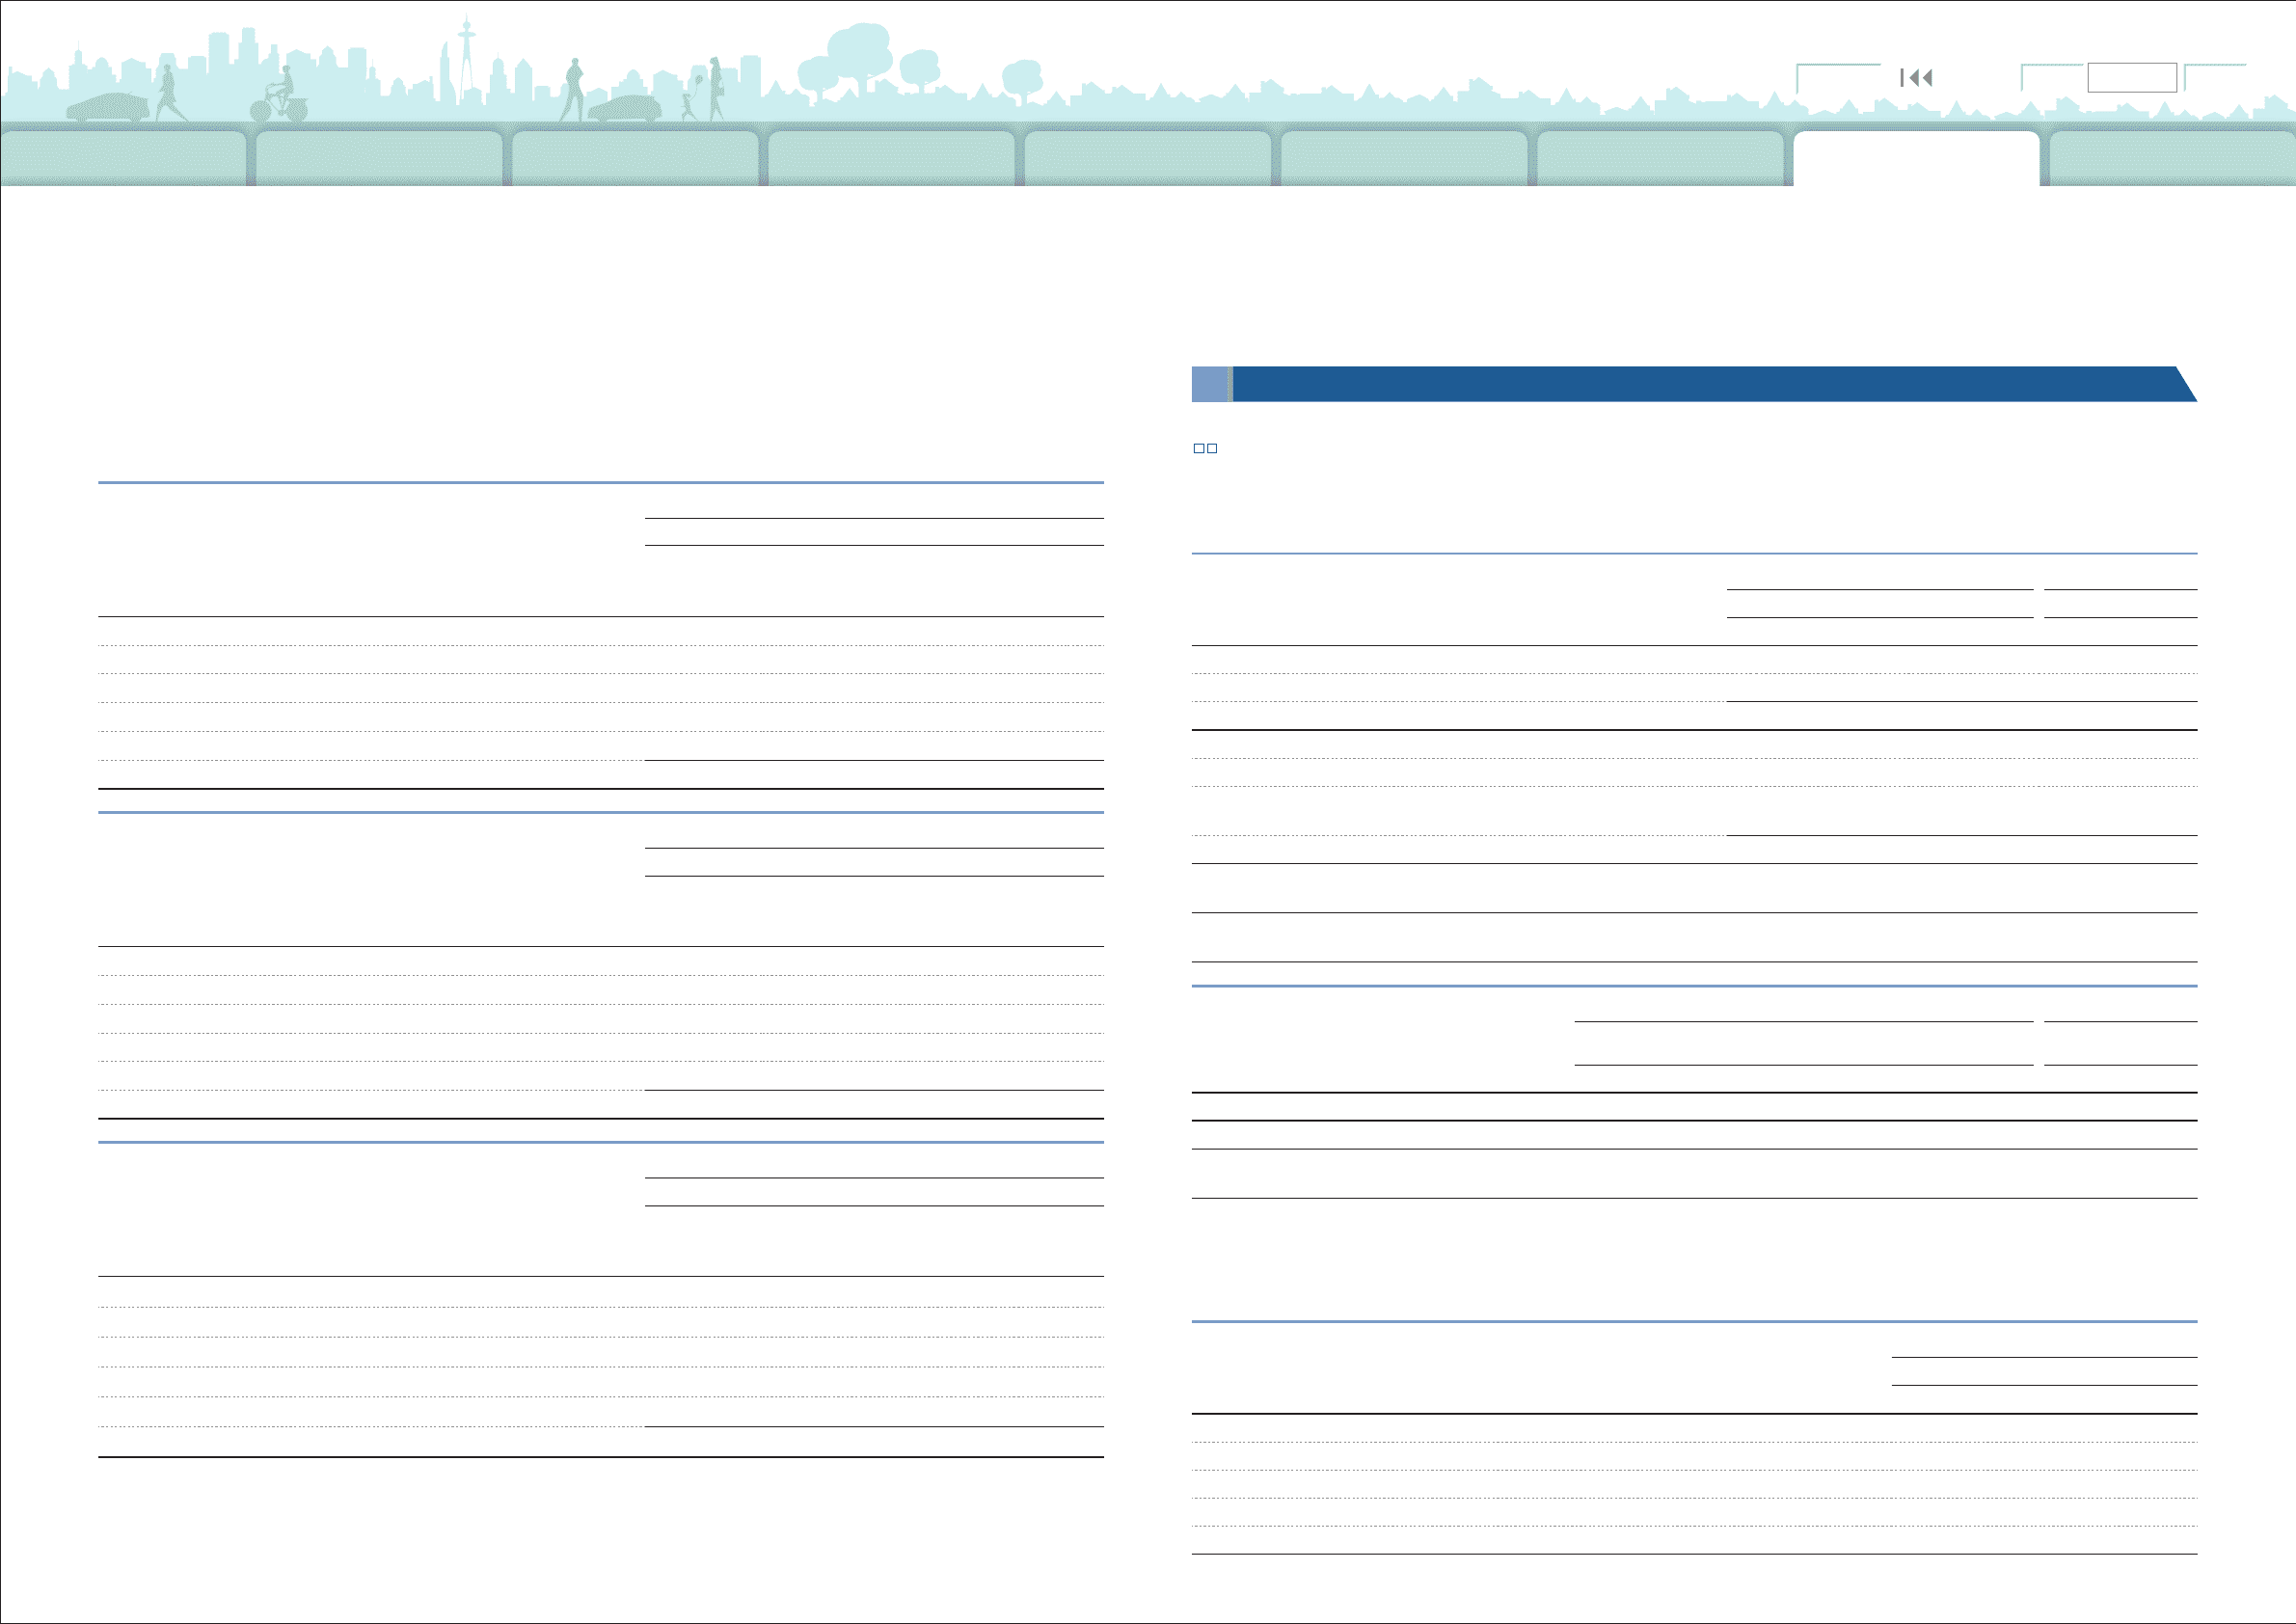
Notes to Consolidated Financial Statements
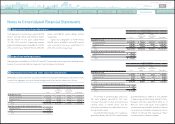
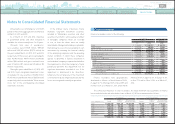
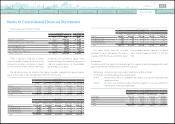
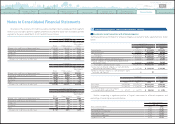
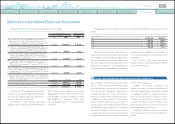
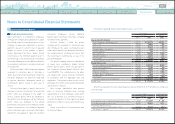
An analysis of the allowance for credit losses above relating to retail receivables portfolio segment,
finance lease receivables portfolio segment and wholesale and other dealer loan receivables portfolio
segment for the years ended March 31, 2011 and 2012 are as follows:
Yen in millions
For the year ended March 31, 2011
Retail Finance leases
Wholesale and
Other dealer
loans
Allowance for credit losses at beginning of year ¥ 160,350 ¥36,918 ¥35,211
Provision for credit losses, net of reversal
(
2,660
)
6,023 2,098
Charge-offs
(
68,122
) (
2,820
) (
5,885
)
Recoveries 14,159 288 636
Other
(
11,528
) (
4,385
) (
3,480
)
Allowance for credit losses at end of year ¥ 92,199 ¥36,024 ¥28,580
Yen in millions
For the year ended March 31, 2012
Retail Finance leases
Wholesale and
Other dealer
loans
Allowance for credit losses at beginning of year ¥92,199 ¥36,024 ¥28,580
Provision for credit losses, net of reversal 13,569
(
4,508
) (
4,767
)
Charge-offs
(
44,742
) (
2,499
) (
305
)
Recoveries 14,051 718 16
Other 2,276 902 714
Allowance for credit losses at end of year ¥77,353 ¥30,637 ¥24,238
U.S. dollars in millions
For the year ended March 31, 2012
Retail Finance leases
Wholesale and
Other dealer
loans
Allowance for credit losses at beginning of year $1,122 $438 $348
Provision for credit losses, net of reversal 165
(
55
) (
58
)
Charge-offs
(
545
) (
30
) (
4
)
Recoveries 171 9 0
Other 28 11 9
Allowance for credit losses at end of year $ 941 $373 $295
Affiliated companies and variable interest entities: 12
Summarized financial information for affiliated companies accounted for by the equity method is shown
below:
Entities comprising a significant portion of Toyota
ʼ
s investment in affiliated companies and
percentage of ownership are presented below:
■
Investments in and transactions with affiliated companies
Yen in millions
U.S. dollars in millions
March 31, March 31,
2011 2012 2012
Current assets ¥ 7,973,712 ¥ 9,112,895 $110,876
Noncurrent assets 6,815,361 6,914,208 84,125
Total assets ¥ 14,789,073 ¥ 16,027,103 $195,001
Current liabilities ¥ 5,141,461 ¥ 5,847,495 $ 71,146
Long-term liabilities and noncontrolling interests 3,726,952 4,032,045 49,058
Affiliated companies accounted for by the equity method
shareholders
ʼ
equity 5,920,660 6,147,563 74,797
Total liabilities and shareholders
ʼ
equity ¥ 14,789,073 ¥ 16,027,103 $195,001
Toyota
ʼ
s share of affiliated companies accounted for by the
equity method shareholders
ʼ
equity ¥ 1,817,988 ¥ 1,914,129 $ 23,289
Number of affiliated companies accounted for by the equity
method at end of period 56 57
Percentage of ownership
March 31,
Name of affiliated companies 2011 2012
Denso Corporation 24.7% 24.9%
Toyota Industries Corporation 24.8% 24.8%
Aisin Seiki Co., Ltd. 23.1% 23.4%
Toyota Tsusho Corporation 21.8% 22.1%
Toyoda Gosei Co., Ltd. 43.1% 43.1%
Yen in millions
U.S. dollars in millions
For the years ended March 31,
For the year ended
March 31,
2010 2011 2012 2012
Net revenues
¥ 20,599,586 ¥ 21,874,143 ¥ 22,211,233 $270,243
Gross profit
¥ 2,269,109 ¥ 2,342,706 ¥ 2,297,660 $ 27,955
Net income attributable to affiliated companies
accounted for by the equity method
¥ 317,017 ¥ 641,771 ¥ 554,983 $ 6,752
0820
Search NextPrev page 94
Contents