Toyota 2012 Annual Report Download - page 46
Download and view the complete annual report
Please find page 46 of the 2012 Toyota annual report below. You can navigate through the pages in the report by either clicking on the pages listed below, or by using the keyword search tool below to find specific information within the annual report.-
 1
1 -
2
-
3
-
4
-
5
-
6
-
7
-
8
-
9
-
10
-
11
-
12
-
13
-
14
-
15
-
16
-
17
-
18
-
19
-
20
-
21
-
22
-
23
-
24
-
25
-
26
-
27
-
28
-
29
-
30
-
31
-
32
-
33
-
34
-
35
-
 36
36 -
 37
37 -
 38
38 -
 39
39 -
 40
40 -
 41
41 -
 42
42 -
 43
43 -
 44
44 -
 45
45 -
 46
46 -
 47
47 -
 48
48 -
 49
49 -
 50
50 -
 51
51 -
 52
52 -
 53
53 -
 54
54 -
 55
55 -
 56
56 -
57
-
58
-
59
-
60
-
61
-
62
-
63
-
64
-
65
-
66
-
67
-
68
-
69
-
70
-
71
-
72
-
73
-
74
-
75
-
76
-
77
-
78
-
79
-
80
-
81
-
82
-
83
-
84
-
85
-
86
-
87
-
88
-
89
-
90
-
91
-
92
-
93
-
94
-
95
-
96
-
97
-
98
-
99
-
100
-
101
-
102
-
103
-
104
-
105
-
106
-
107
-
108
-
109
-
110
-
111
-
112
-
113
-
114
-
115
-
116
-
117
-
118
-
119
-
120
-
121
-
122
-
123
-
124
-
125
-
126
-
127
 |
 |
TOYOTA ANNUAL REPORT 2012
Toyota Global Vision Changes for Making
Ever-Better Cars President
ʼ
s Message Medium- to Long-Term
Growth Initiatives Special Feature Management and
Corporate Information Investor Information
Business and
Performance Review Financial Section
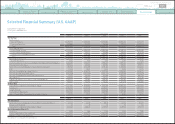
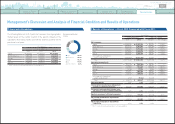
Selected Financial Summary
(
U.S. GAAP
)
Yen in millions % change
2008 2009 2010 2011 2012 2012 vs. 2011
For the Year:
Net Revenues:
Sales of Products ¥24,820,510 ¥19,173,720 ¥17,724,729 ¥17,820,520 ¥17,511,916
-
1.7
Financing Operations 1,468,730 1,355,850 1,226,244 1,173,168 1,071,737
-
8.6
Total ¥26,289,240 ¥20,529,570 ¥18,950,973 ¥18,993,688 ¥18,583,653
-
2.2
Costs and Expenses:
Cost of Products Sold ¥20,452,338 ¥17,468,416 ¥15,971,496 ¥15,985,783 ¥15,795,918
-
1.2
Cost of Financing Operations 1,068,015 987,384 712,301 629,543 592,646
-
5.9
Selling, General and Administrative 2,498,512 2,534,781 2,119,660 1,910,083 1,839,462
-
3.7
Total ¥24,018,865 ¥20,990,581 ¥18,803,457 ¥18,525,409 ¥18,228,026
-
1.6
Operating Income
(
Loss
)
¥ 2,270,375 ¥
(
461,011
)
¥ 147,516 ¥ 468,279 ¥ 355,627
-
24.1
% of Net Revenues 8.6%
−
2.2% 0.8% 2.5% 1.9%
―
Income
(
Loss
)
before Income Taxes and Equity in Earnings of Affiliated Companies
2,437,222
(
560,381
)
291,468 563,290 432,873
-
23.2
Provision for Income Taxes 911,495
(
56,442
)
92,664 312,821 262,272
-
16.2
Net Income
(
Loss
)
attributable to Toyota Motor Corporation 1,717,879
(
436,937
)
209,456 408,183 283,559
-
30.5
ROE 14.5%
−
4.0% 2.1% 3.9% 2.7%
―
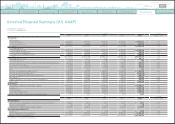
Net Cash Provided by Operating Activities ¥ 2,981,624 ¥ 1,476,905 ¥ 2,558,530 ¥ 2,024,009 ¥ 1,452,435
-
28.2
Net Cash Used in Investing Activities
(
3,874,886
) (
1,230,220
) (
2,850,184
) (
2,116,344
)(
1,442,658
)―
Net Cash Provided by
(
Used in
)
Financing Activities 706,189 698,841
(
277,982
)
434,327
(
355,347
)
―
R&D Expenses 958,882 904,075 725,345 730,340 779,806 +6.8
Capital Expenditures for Property, Plant and Equipment* 1,480,570 1,364,582 604,536 629,326 723,537 +15.0
Depreciation 1,491,135 1,495,170 1,414,569 1,175,573 1,067,830
-
9.2
At Year-End:
Toyota Motor Corporation Shareholders
ʼ
Equity ¥11,869,527 ¥10,061,207 ¥10,359,723 ¥10,332,371 ¥10,550,261 +2.1
Total Assets 32,458,320 29,062,037 30,349,287 29,818,166 30,650,965 +2.8
Long-Term Debt 5,981,931 6,301,469 7,015,409 6,449,220 6,042,277
-
6.3
Cash and Cash Equivalents 1,628,547 2,444,280 1,865,746 2,080,709 1,679,200
-
19.3
Ratio of Toyota Motor Corporation Shareholders
ʼ
Equity 36.6% 34.6% 34.1% 34.7% 34.4%
―
Yen % change
2008 2009 2010 2011 2012 2012 vs. 2011
Per Share Data:
Net Income
(
Loss
)
attributable to Toyota Motor Corporation
(
Basic
)
¥ 540.65 ¥
(
139.13
)
¥ 66.79 ¥ 130.17 ¥ 90.21
-
30.7
Annual Cash Dividends 140 100 45 50 50
―
Toyota Motor Corporation Shareholders
ʼ
Equity 3,768.97 3,208.41 3,303.49 3,295.08 3,331.51 +1.1
Stock Information
(
March 31
)
:
Stock Price ¥ 4,970 ¥ 3,120 ¥ 3,745 ¥ 3,350 ¥ 3,570 +6.6
Market Capitalization
(
Yen in millions
)
¥17,136,548 ¥10,757,752 ¥12,912,751 ¥11,550,792 ¥12,309,351 +6.6
Number of Shares Issued
(
shares
)
3,447,997,492 3,447,997,492 3,447,997,492 3,447,997,492 3,447,997,492
―
Toyota Motor Corporation
Fiscal years ended March 31
* Excluding vehicles and equipment of operating leases
0820
Search NextPrev page 46
Contents