Toyota 2012 Annual Report Download - page 52
Download and view the complete annual report
Please find page 52 of the 2012 Toyota annual report below. You can navigate through the pages in the report by either clicking on the pages listed below, or by using the keyword search tool below to find specific information within the annual report.-
 1
1 -
2
-
3
-
4
-
5
-
6
-
7
-
8
-
9
-
10
-
11
-
12
-
13
-
14
-
15
-
16
-
17
-
18
-
19
-
20
-
21
-
22
-
23
-
24
-
25
-
26
-
27
-
28
-
29
-
30
-
31
-
32
-
33
-
34
-
35
-
36
-
37
-
38
-
39
-
40
-
41
-
 42
42 -
 43
43 -
 44
44 -
 45
45 -
 46
46 -
 47
47 -
 48
48 -
 49
49 -
 50
50 -
 51
51 -
 52
52 -
 53
53 -
 54
54 -
 55
55 -
 56
56 -
 57
57 -
 58
58 -
 59
59 -
 60
60 -
 61
61 -
 62
62 -
63
-
64
-
65
-
66
-
67
-
68
-
69
-
70
-
71
-
72
-
73
-
74
-
75
-
76
-
77
-
78
-
79
-
80
-
81
-
82
-
83
-
84
-
85
-
86
-
87
-
88
-
89
-
90
-
91
-
92
-
93
-
94
-
95
-
96
-
97
-
98
-
99
-
100
-
101
-
102
-
103
-
104
-
105
-
106
-
107
-
108
-
109
-
110
-
111
-
112
-
113
-
114
-
115
-
116
-
117
-
118
-
119
-
120
-
121
-
122
-
123
-
124
-
125
-
126
-
127
 |
 |
TOYOTA ANNUAL REPORT 2012
Toyota Global Vision Changes for Making
Ever-Better Cars President
ʼ
s Message Medium- to Long-Term
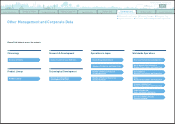
Growth Initiatives Special Feature Management and
Corporate Information Investor Information
Business and
Performance Review Financial Section
Management's Discussion and Analysis of Financial Condition and Results of Operations
GAAP measures. However, Toyota believes that
such results excluding the impact of currency
fluctuations year-on-year provide additional
useful information to investors regarding the
operating performance on a local currency basis.
Toyota
ʼ
s most significant business segment is
its automotive operations. Toyota carries out its
automotive operations as a global competitor in
the worldwide automotive market. Management
allocates resources to, and assesses the
performance of, its automotive operations as
a single business segment on a worldwide
basis. Toyota does not manage any subset of
its automotive operations, such as domestic
or overseas operations or parts, as separate
management units.
The management of the automotive operations
is aligned on a functional basis with managers
having oversight responsibility for the major
operating functions within the segment.
Management assesses financial and non-financial
data such as vehicle unit sales, production
volume, market share information, vehicle
model plans and plant location costs to allocate
resources within the automotive operations.
production facilities in different parts of the world
has significantly reduced the level of transaction
risk. As part of its globalization strategy,
Toyota has continued to localize production by
constructing production facilities in the major
markets in which it sells its vehicles. In calendar
2010 and 2011, Toyota produced 73.4% and
71.3% of its non-domestic sales outside Japan,
respectively. In North America, 72.6% and
66.8% of vehicles sold in calendar 2010 and 2011
respectively were produced locally. In Europe,
59.0% and 57.7% of vehicles sold in calendar 2010
and 2011 respectively were produced locally.
Localizing production enables Toyota to locally
purchase many of the supplies and resources
used in the production process, which allows for
a better match of local currency revenues with
local currency expenses.
Toyota also enters into foreign currency
transactions and other hedging instruments to
address a portion of its transaction risk. This has
reduced, but not eliminated, the effects of foreign
currency exchange rate fluctuations, which in
some years can be significant. See notes 20 and
21 to the consolidated financial statements for
additional information.
Generally, a weakening of the Japanese yen
against other currencies has a positive effect
on Toyota
ʼ
s revenues, operating income and net
income attributable to Toyota Motor Corporation.
A strengthening of the Japanese yen against other
currencies has the opposite effect. In fiscal 2011
and 2012, the Japanese yen was on average and
at the end of each fiscal year stronger against the
U.S. dollar and the euro in comparison to the prior
fiscal year. See further discussion in
“
Quantitative
and Qualitative Disclosures about Market Risk
—
Market Risk Disclosures
—
Foreign Currency
Exchange Rate Risk
”
.
During fiscal 2011 and 2012, the average
exchange rate of the Japanese yen strengthened
against the major currencies including the
U.S. dollar and the euro compared with the
average exchange rate of the prior fiscal year.
The operating results excluding the impact of
currency fluctuations described in
“
Results of
Operations
—
Fiscal 2012 Compared with Fiscal
2011
”
and
“
Results of Operations
—
Fiscal 2011
Compared with Fiscal 2010
”
show results of net
revenues obtained by applying the Japanese yen
ʼ
s
average exchange rate in the previous fiscal year
to the local currency-denominated net revenues
for fiscal 2011 and 2012, respectively, as if the
value of the Japanese yen had remained constant
for the comparable periods. Results excluding the
impact of currency fluctuations year-on-year are
not on the same basis as Toyota
ʼ
s consolidated
financial statements and do not conform with
U.S. GAAP. Furthermore, Toyota does not believe
that these measures are a substitute for U.S.
Toyota is affected by fluctuations in foreign
currency exchange rates. In addition to the
Japanese yen, Toyota is exposed to fluctuations
in the value of the U.S. dollar and the euro and,
to a lesser extent, the Australian dollar, the
Canadian dollar, the British pound, and others.
Toyota
ʼ
s consolidated financial statements, which
are presented in Japanese yen, are affected by
foreign currency exchange fluctuations through
both translation risk and transaction risk.
Translation risk is the risk that Toyota
ʼ
s
consolidated financial statements for a particular
period or for a particular date will be affected by
changes in the prevailing exchange rates of the
currencies in those countries in which Toyota
does business compared with the Japanese
yen. Even though the fluctuations of currency
exchange rates to the Japanese yen can be
substantial, and, therefore, significantly impact
comparisons with prior periods and among the
various geographic markets, the translation risk
is a reporting consideration and does not reflect
Toyota
ʼ
s underlying results of operations. Toyota
does not hedge against translation risk.
Transaction risk is the risk that the currency
structure of Toyota
ʼ
s costs and liabilities will
deviate from the currency structure of sales
proceeds and assets. Transaction risk relates
primarily to sales proceeds from Toyota
ʼ
s
non-domestic operations from vehicles produced
in Japan.
Toyota believes that the location of its
■
Currency Fluctuations
■
Segmentation
0820
Search NextPrev page 52
Contents